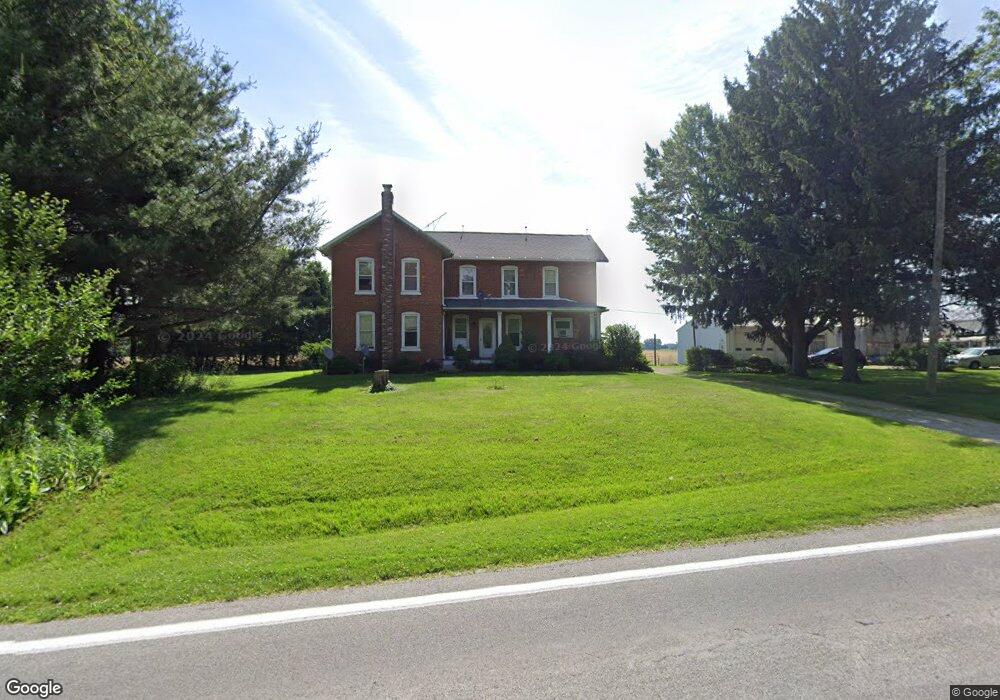
1705 S State Route 19 Fremont, OH 43420
Estimated Value: $241,000 - $272,000
4
Beds
3
Baths
2,016
Sq Ft
$129/Sq Ft
Est. Value
About This Home
This home is located at 1705 S State Route 19, Fremont, OH 43420 and is currently estimated at $259,240, approximately $128 per square foot. 1705 S State Route 19 is a home located in Sandusky County with nearby schools including Clyde High School, Temple Christian Academy, and Sacred Heart School.
Ownership History
Date
Name
Owned For
Owner Type
Purchase Details
Closed on
Jul 16, 2021
Sold by
Bartrom Dianna L and Bartrom Terry L
Bought by
Bartrom Terry L and Bartrom Dianna L
Current Estimated Value
Home Financials for this Owner
Home Financials are based on the most recent Mortgage that was taken out on this home.
Original Mortgage
$115,000
Outstanding Balance
$96,253
Interest Rate
2.93%
Mortgage Type
Future Advance Clause Open End Mortgage
Estimated Equity
$162,987
Purchase Details
Closed on
Oct 1, 1999
Sold by
Nott Dennis P
Bought by
Bartrom Dianna L and Bartrom Terry L
Home Financials for this Owner
Home Financials are based on the most recent Mortgage that was taken out on this home.
Original Mortgage
$136,000
Interest Rate
7.93%
Mortgage Type
New Conventional
Create a Home Valuation Report for This Property
The Home Valuation Report is an in-depth analysis detailing your home's value as well as a comparison with similar homes in the area
Home Values in the Area
Average Home Value in this Area
Purchase History
| Date | Buyer | Sale Price | Title Company |
|---|---|---|---|
| Bartrom Terry L | -- | Assured Title Agency | |
| Bartrom Terry L | -- | Assured Title | |
| Bartrom Dianna L | $136,000 | -- |
Source: Public Records
Mortgage History
| Date | Status | Borrower | Loan Amount |
|---|---|---|---|
| Open | Bartrom Terry L | $115,000 | |
| Closed | Bartrom Terry L | $115,000 | |
| Previous Owner | Bartrom Dianna L | $136,000 |
Source: Public Records
Tax History Compared to Growth
Tax History
| Year | Tax Paid | Tax Assessment Tax Assessment Total Assessment is a certain percentage of the fair market value that is determined by local assessors to be the total taxable value of land and additions on the property. | Land | Improvement |
|---|---|---|---|---|
| 2024 | $2,983 | $79,420 | $15,440 | $63,980 |
| 2023 | $2,983 | $63,530 | $12,360 | $51,170 |
| 2022 | $2,609 | $63,530 | $12,360 | $51,170 |
| 2021 | $2,276 | $63,530 | $12,360 | $51,170 |
| 2020 | $1,872 | $52,150 | $12,040 | $40,110 |
| 2019 | $1,851 | $52,150 | $12,040 | $40,110 |
| 2018 | $1,850 | $52,150 | $12,040 | $40,110 |
| 2017 | $1,712 | $47,850 | $12,040 | $35,810 |
| 2016 | $1,687 | $47,850 | $12,040 | $35,810 |
| 2015 | $1,667 | $47,850 | $12,040 | $35,810 |
| 2014 | $1,558 | $43,580 | $11,030 | $32,550 |
| 2013 | $1,523 | $43,580 | $11,030 | $32,550 |
Source: Public Records
Map
Nearby Homes
- V/L County Road 220
- 0 County Road 220
- 2314 E Sr 20
- 236 Spayd Rd
- 220 Maple Ln Unit 82
- 0 Cr 214 Unit 20253055
- 1014 S County Road 198
- 104 Ken Lee Dr
- 0 Merlin Ln Unit 20253762
- 0 Merlin Ln Unit 20253639
- 2248 E State St
- 1270 W Mcpherson Hwy
- 628 W Maple St
- 1739 E State St Unit 23
- 761 N Woodland Ave
- 18 Katlyn Dr
- 199 Saint Thomas Dr
- 933 E Cole Rd
- 800 Lawndale Dr
- 1526 Sunrise Blvd
- 1645 S State Route 19
- 1847 S State Route 19
- 1868 S State Route 19
- 1623 S State Route 19
- 2815 Finefrock Rd
- 3030 County Road 192
- 192 Cr
- 2832 Cr 192
- 1488 S State Route 19
- 1478 S State Route 19
- 2023 S State Route 19
- 1 W Covington Ave
- 01 W Covington Ave Unit /00
- 01 W Covington Ave
- 2735 Finefrock Rd
- 2923 County Road 192
- 2935 County Road 192
- 2727 Finefrock Rd
- 1856 County Road 207
- 2711 Finefrock Rd