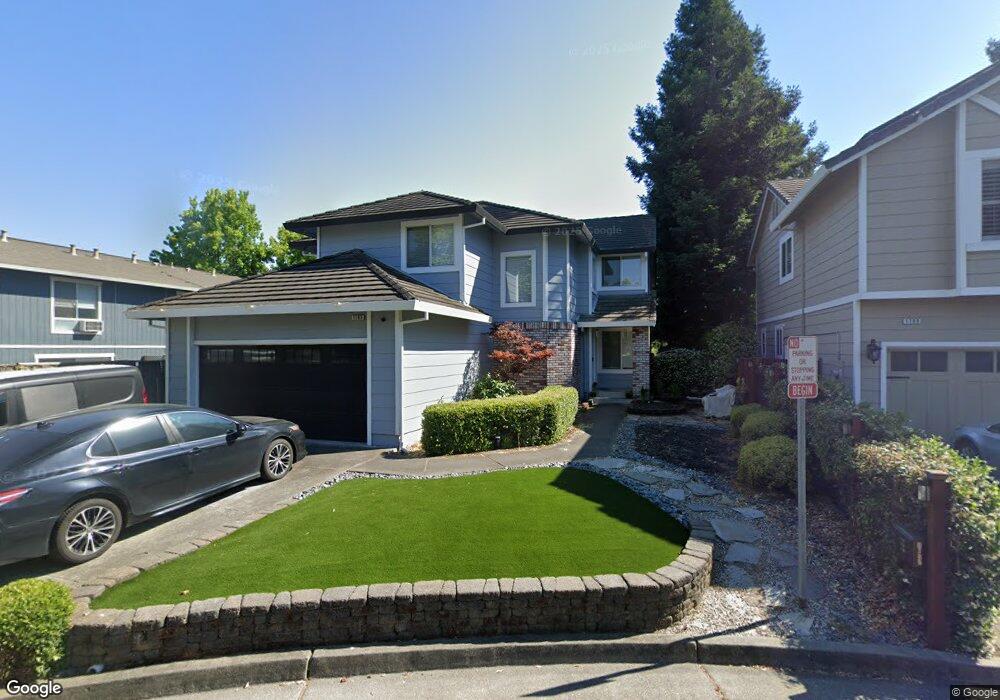
1705 Spyglass Rd Petaluma, CA 94954
Adobe NeighborhoodEstimated Value: $991,000 - $1,132,000
4
Beds
3
Baths
2,362
Sq Ft
$457/Sq Ft
Est. Value
About This Home
This home is located at 1705 Spyglass Rd, Petaluma, CA 94954 and is currently estimated at $1,078,602, approximately $456 per square foot. 1705 Spyglass Rd is a home located in Sonoma County with nearby schools including Kenilworth Junior High School, Casa Grande High School, and Miwok Valley Elementary Charter School.
Ownership History
Date
Name
Owned For
Owner Type
Purchase Details
Closed on
Jun 12, 2000
Sold by
Welch Marlon F A
Bought by
Welch Cheryl
Current Estimated Value
Home Financials for this Owner
Home Financials are based on the most recent Mortgage that was taken out on this home.
Original Mortgage
$75,000
Interest Rate
8.27%
Purchase Details
Closed on
Jun 9, 2000
Sold by
Burgan Philippe and Burgan Janice
Bought by
Welch Cheryl
Home Financials for this Owner
Home Financials are based on the most recent Mortgage that was taken out on this home.
Original Mortgage
$75,000
Interest Rate
8.27%
Purchase Details
Closed on
Nov 12, 1993
Sold by
Arrighi Louis A and Arrighi Barbara A
Bought by
Burgan Philippe and Burgan Janice
Home Financials for this Owner
Home Financials are based on the most recent Mortgage that was taken out on this home.
Original Mortgage
$158,500
Interest Rate
6.88%
Create a Home Valuation Report for This Property
The Home Valuation Report is an in-depth analysis detailing your home's value as well as a comparison with similar homes in the area
Home Values in the Area
Average Home Value in this Area
Purchase History
| Date | Buyer | Sale Price | Title Company |
|---|---|---|---|
| Welch Cheryl | -- | First American Title Co | |
| Welch Cheryl | $437,000 | First American Title Co | |
| Burgan Philippe | -- | North American Title |
Source: Public Records
Mortgage History
| Date | Status | Borrower | Loan Amount |
|---|---|---|---|
| Previous Owner | Welch Cheryl | $75,000 | |
| Previous Owner | Burgan Philippe | $158,500 |
Source: Public Records
Tax History Compared to Growth
Tax History
| Year | Tax Paid | Tax Assessment Tax Assessment Total Assessment is a certain percentage of the fair market value that is determined by local assessors to be the total taxable value of land and additions on the property. | Land | Improvement |
|---|---|---|---|---|
| 2025 | $7,498 | $671,652 | $284,334 | $387,318 |
| 2024 | $7,498 | $658,483 | $278,759 | $379,724 |
| 2023 | $7,498 | $645,573 | $273,294 | $372,279 |
| 2022 | $7,319 | $632,916 | $267,936 | $364,980 |
| 2021 | $7,231 | $620,507 | $262,683 | $357,824 |
| 2020 | $7,115 | $614,145 | $259,990 | $354,155 |
| 2019 | $7,024 | $602,104 | $254,893 | $347,211 |
| 2018 | $6,993 | $590,299 | $249,896 | $340,403 |
| 2017 | $6,850 | $578,726 | $244,997 | $333,729 |
| 2016 | $6,692 | $567,380 | $240,194 | $327,186 |
| 2015 | $6,601 | $558,859 | $236,587 | $322,272 |
| 2014 | $6,443 | $537,000 | $227,000 | $310,000 |
Source: Public Records
Map
Nearby Homes
- 12 Birnam Wood Ct
- 1727 Chinar Dr
- 2014 Crinella Dr
- 1694 Southridge Dr
- 1180 Wieling Way
- 1917 Falcon Ridge Dr
- 2 Wedgewood Ct
- 1878 Adobe Creek Dr
- 4 Starling Dr
- 1052 Helen Ct
- 1120 S Mcdowell Blvd
- 1513 Elizabeth Dr
- 1103 Marylyn Cir
- 602 Marylyn Cir
- 601 Marylyn Cir Unit 21
- 2189 Saint Augustine Cir
- 1302 Marylyn Cir
- 1711 Capistrano Dr
- 827 Grouse Ln
- 859 S Mcdowell Blvd
- 1709 Spyglass Rd
- 1712 Spyglass Rd
- 1704 Spyglass Rd
- 1708 Spyglass Rd
- 1273 Del Rancho Way
- 1269 Del Rancho Way
- 1710 Silverado Cir
- 1714 Silverado Cir
- 1680 Calle Ranchero
- 1269 Del Sol Way
- 1718 Silverado Cir
- 1706 Silverado Cir
- 1676 Calle Ranchero
- 1277 Del Rancho Way
- 1265 Del Rancho Way
- 1281 Del Rancho Way
- 1261 Del Rancho Way
- 1702 Silverado Cir
- 1672 Calle Ranchero