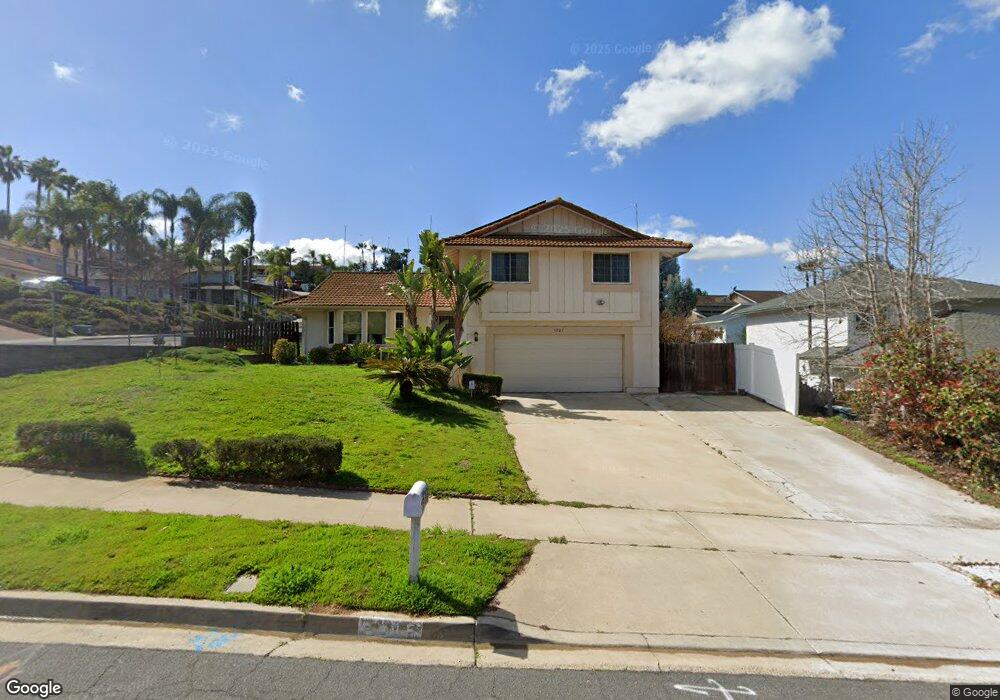
1705 W 11th Ave Escondido, CA 92029
Vineyard NeighborhoodEstimated Value: $932,000 - $972,000
4
Beds
3
Baths
1,855
Sq Ft
$513/Sq Ft
Est. Value
About This Home
This home is located at 1705 W 11th Ave, Escondido, CA 92029 and is currently estimated at $952,053, approximately $513 per square foot. 1705 W 11th Ave is a home located in San Diego County with nearby schools including Miller Elementary School, Del Dios Academy of Arts & Sciences, and Escondido High School.
Ownership History
Date
Name
Owned For
Owner Type
Purchase Details
Closed on
Apr 15, 2010
Sold by
Montllor Gregory J
Bought by
Montllor Gregory J
Current Estimated Value
Home Financials for this Owner
Home Financials are based on the most recent Mortgage that was taken out on this home.
Original Mortgage
$123,700
Outstanding Balance
$82,020
Interest Rate
4.91%
Mortgage Type
New Conventional
Estimated Equity
$870,033
Purchase Details
Closed on
Apr 18, 2003
Sold by
Montllor Gregory J
Bought by
Montllor Gregory J
Purchase Details
Closed on
Mar 1, 1999
Sold by
Maloney Michael A
Bought by
Montllor Gregory J
Home Financials for this Owner
Home Financials are based on the most recent Mortgage that was taken out on this home.
Original Mortgage
$182,000
Interest Rate
6.73%
Purchase Details
Closed on
Jul 30, 1993
Purchase Details
Closed on
Aug 11, 1987
Create a Home Valuation Report for This Property
The Home Valuation Report is an in-depth analysis detailing your home's value as well as a comparison with similar homes in the area
Home Values in the Area
Average Home Value in this Area
Purchase History
| Date | Buyer | Sale Price | Title Company |
|---|---|---|---|
| Montllor Gregory J | -- | Chicago Title Company | |
| Montllor Gregory J | -- | Chicago Title Company | |
| Montllor Gregory J | -- | -- | |
| Montllor Gregory J | $227,500 | California Title Company | |
| -- | $162,500 | -- | |
| -- | $124,200 | -- |
Source: Public Records
Mortgage History
| Date | Status | Borrower | Loan Amount |
|---|---|---|---|
| Open | Montllor Gregory J | $123,700 | |
| Closed | Montllor Gregory J | $182,000 | |
| Closed | Montllor Gregory J | $22,700 |
Source: Public Records
Tax History Compared to Growth
Tax History
| Year | Tax Paid | Tax Assessment Tax Assessment Total Assessment is a certain percentage of the fair market value that is determined by local assessors to be the total taxable value of land and additions on the property. | Land | Improvement |
|---|---|---|---|---|
| 2025 | $3,938 | $356,631 | $106,670 | $249,961 |
| 2024 | $3,938 | $349,639 | $104,579 | $245,060 |
| 2023 | $3,848 | $342,784 | $102,529 | $240,255 |
| 2022 | $3,805 | $336,064 | $100,519 | $235,545 |
| 2021 | $3,742 | $329,476 | $98,549 | $230,927 |
| 2020 | $3,720 | $326,099 | $97,539 | $228,560 |
| 2019 | $3,629 | $319,706 | $95,627 | $224,079 |
| 2018 | $3,527 | $313,438 | $93,752 | $219,686 |
| 2017 | $40 | $307,293 | $91,914 | $215,379 |
| 2016 | $3,400 | $301,268 | $90,112 | $211,156 |
| 2015 | $3,371 | $296,744 | $88,759 | $207,985 |
| 2014 | $3,230 | $290,932 | $87,021 | $203,911 |
Source: Public Records
Map
Nearby Homes
- 1110 Gaucho Place
- 1001 S Hale Ave Unit 13
- 1225 Lancer Glen
- 1575 W Valley Pkwy Unit 25
- 1045 Howard Ave
- 1007 Howard Ave Unit 42
- 955 Howard Ave Unit 40
- 1461 Autumn Woods Place
- 2243 Avenida Del Diablo
- 1756 Alhudson Dr
- 1750 W Citracado Pkwy Unit 157
- 2010 Palsero Ave
- 1369 W 11th Ave
- 1729 Mesa Grande Rd
- 1772 Crescent Knolls Glen
- 1630 Amanda Glen Ln
- 1751 Citracado Pkwy Unit SPC 288
- 1640 Amanda Glen Ln
- 1390 Amanda Glen Ln N
- 1390 Amanda Ln
- 1713 W 11th Ave
- 1719 W 11th Ave
- 1104 Pasadero Dr
- 1110 Pasadero Dr
- 1710 W 11th Ave
- 1727 W 11th Ave
- 1704 W 11th Ave
- 1818 Navajo Place
- 1718 W 11th Ave
- 1696 W 11th Ave
- 1116 Pasadero Dr
- 1673 W 11th Ave
- 1118 Gaucho Place
- 1126 Gaucho Place
- 1722 W 11th Ave
- 1690 W 11th Ave
- 1810 Navajo Place
- 1134 Gaucho Place
- 1085 Dragt Place
- 1826 Navajo Place