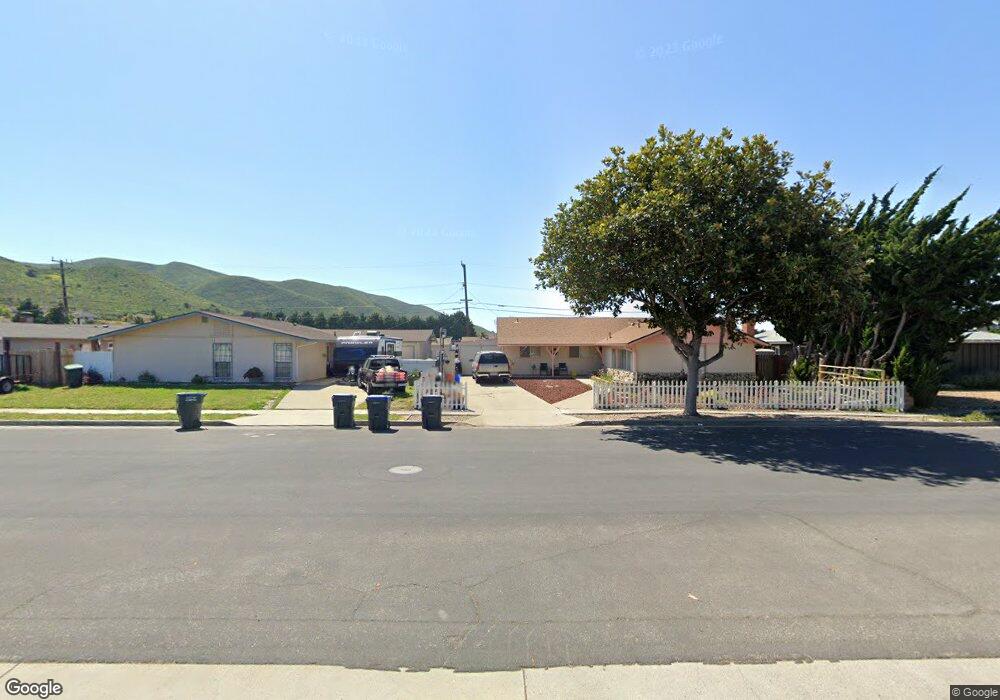
1705 W Loquat Ave Lompoc, CA 93436
Estimated Value: $744,630 - $790,000
4
Beds
3
Baths
2,567
Sq Ft
$301/Sq Ft
Est. Value
About This Home
This home is located at 1705 W Loquat Ave, Lompoc, CA 93436 and is currently estimated at $773,658, approximately $301 per square foot. 1705 W Loquat Ave is a home located in Santa Barbara County with nearby schools including Miguelito Elementary School, Lompoc Valley Middle School, and Lompoc High School.
Ownership History
Date
Name
Owned For
Owner Type
Purchase Details
Closed on
Apr 30, 2005
Sold by
Lincoln Trust Co and Grotenhuis David W
Bought by
Riley Gregory and Riley Deidre D
Current Estimated Value
Home Financials for this Owner
Home Financials are based on the most recent Mortgage that was taken out on this home.
Original Mortgage
$496,800
Outstanding Balance
$263,678
Interest Rate
6.12%
Mortgage Type
New Conventional
Estimated Equity
$509,980
Purchase Details
Closed on
Oct 6, 2004
Sold by
Crown Pointe Lompoc Llc
Bought by
Lincoln Trust Co and Grotenhuis David W
Create a Home Valuation Report for This Property
The Home Valuation Report is an in-depth analysis detailing your home's value as well as a comparison with similar homes in the area
Home Values in the Area
Average Home Value in this Area
Purchase History
| Date | Buyer | Sale Price | Title Company |
|---|---|---|---|
| Riley Gregory | $621,000 | First American Title Company | |
| Lincoln Trust Co | $442,500 | First American Title |
Source: Public Records
Mortgage History
| Date | Status | Borrower | Loan Amount |
|---|---|---|---|
| Open | Riley Gregory | $496,800 | |
| Closed | Riley Gregory | $93,150 |
Source: Public Records
Tax History
| Year | Tax Paid | Tax Assessment Tax Assessment Total Assessment is a certain percentage of the fair market value that is determined by local assessors to be the total taxable value of land and additions on the property. | Land | Improvement |
|---|---|---|---|---|
| 2025 | $7,428 | $712,000 | $188,000 | $524,000 |
| 2023 | $7,428 | $617,000 | $163,000 | $454,000 |
| 2022 | $6,774 | $605,000 | $160,000 | $445,000 |
| 2021 | $6,071 | $526,000 | $139,000 | $387,000 |
| 2020 | $5,511 | $478,000 | $126,000 | $352,000 |
| 2019 | $5,528 | $478,000 | $126,000 | $352,000 |
| 2018 | $5,283 | $455,000 | $120,000 | $335,000 |
| 2017 | $5,290 | $455,000 | $176,000 | $279,000 |
| 2016 | $4,817 | $414,000 | $160,000 | $254,000 |
| 2014 | $4,024 | $342,000 | $132,000 | $210,000 |
Source: Public Records
Map
Nearby Homes
- 400 Coronado Dr
- 524 Avalon St
- 1328 W Willow Ave
- 1311 W Cypress Ave Unit B2
- 1410 W Apricot Ave
- 112 N X St
- 1408 W Walnut Ave
- 23 Village Circle Dr
- 413 S O Place
- 267 Village Circle Dr
- 321 N Z St
- 230 N R St
- 1011 W Walnut Ave
- 4314 W Ocean Ave
- 420 N W St
- 516 N U St
- 217 N M St
- 600 N Y St
- 117 S I St
- 215 S H St
Your Personal Tour Guide
Ask me questions while you tour the home.