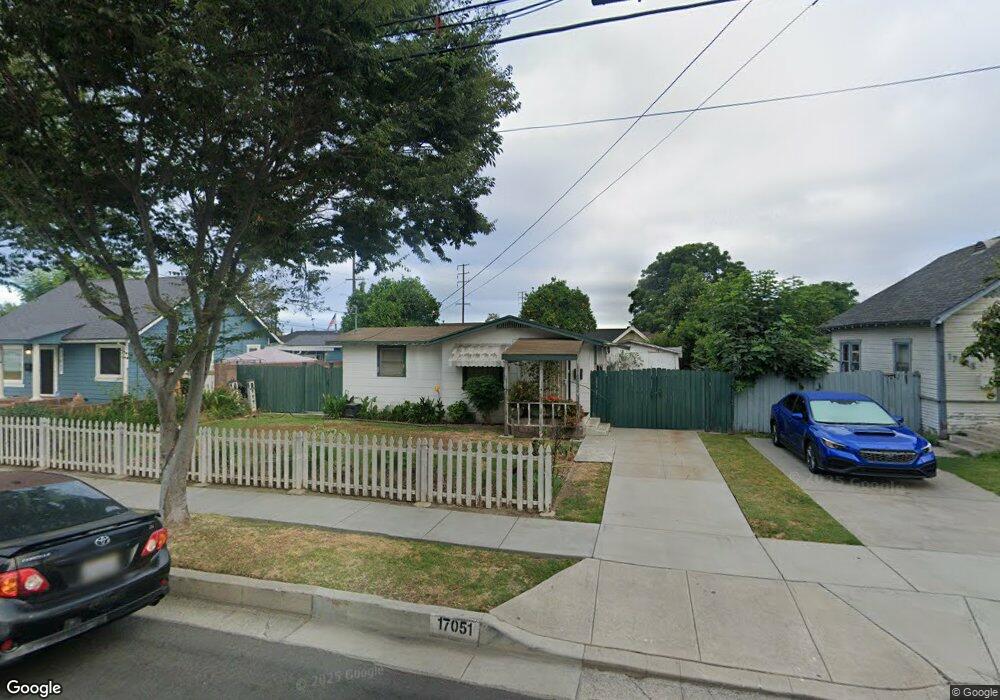
17051 Bixby Ave Bellflower, CA 90706
Estimated Value: $560,602 - $931,000
3
Beds
1
Bath
792
Sq Ft
$896/Sq Ft
Est. Value
About This Home
This home is located at 17051 Bixby Ave, Bellflower, CA 90706 and is currently estimated at $709,651, approximately $896 per square foot. 17051 Bixby Ave is a home located in Los Angeles County with nearby schools including Thomas Jefferson Elementary School, Mayfair High School, and St. Bernard School.
Ownership History
Date
Name
Owned For
Owner Type
Purchase Details
Closed on
Sep 15, 2018
Sold by
Castillo Asuncion
Bought by
Castillo Alfredo M
Current Estimated Value
Purchase Details
Closed on
Nov 6, 1998
Sold by
Castillo Edwin
Bought by
Castillo Asuncion
Purchase Details
Closed on
Jul 30, 1998
Sold by
King Mitch
Bought by
Castillo Alfredo M and Castillo Asuncion
Home Financials for this Owner
Home Financials are based on the most recent Mortgage that was taken out on this home.
Original Mortgage
$119,310
Interest Rate
6.42%
Mortgage Type
FHA
Purchase Details
Closed on
Nov 21, 1997
Sold by
Larsen Edith R Living Trust
Bought by
King Mitch
Home Financials for this Owner
Home Financials are based on the most recent Mortgage that was taken out on this home.
Original Mortgage
$76,000
Interest Rate
6.25%
Purchase Details
Closed on
Jul 11, 1997
Sold by
Larsen Edith R
Bought by
Larsen Edith R and The Edith R Larsen Living Trust
Create a Home Valuation Report for This Property
The Home Valuation Report is an in-depth analysis detailing your home's value as well as a comparison with similar homes in the area
Home Values in the Area
Average Home Value in this Area
Purchase History
| Date | Buyer | Sale Price | Title Company |
|---|---|---|---|
| Castillo Alfredo M | -- | Accommodation | |
| Castillo Asuncion | -- | Landsafe Title | |
| Castillo Alfredo M | $120,000 | Landsafe Title | |
| King Mitch | $95,000 | Landsafe Title | |
| Larsen Edith R | -- | -- |
Source: Public Records
Mortgage History
| Date | Status | Borrower | Loan Amount |
|---|---|---|---|
| Previous Owner | Castillo Alfredo M | $119,310 | |
| Previous Owner | King Mitch | $76,000 |
Source: Public Records
Tax History Compared to Growth
Tax History
| Year | Tax Paid | Tax Assessment Tax Assessment Total Assessment is a certain percentage of the fair market value that is determined by local assessors to be the total taxable value of land and additions on the property. | Land | Improvement |
|---|---|---|---|---|
| 2025 | $2,567 | $188,098 | $147,037 | $41,061 |
| 2024 | $2,567 | $184,410 | $144,154 | $40,256 |
| 2023 | $2,471 | $180,795 | $141,328 | $39,467 |
| 2022 | $2,426 | $177,251 | $138,557 | $38,694 |
| 2021 | $2,376 | $173,777 | $135,841 | $37,936 |
| 2020 | $2,355 | $171,997 | $134,449 | $37,548 |
| 2019 | $2,316 | $168,625 | $131,813 | $36,812 |
| 2018 | $2,135 | $165,320 | $129,229 | $36,091 |
| 2016 | $2,042 | $158,903 | $124,212 | $34,691 |
| 2015 | $1,999 | $156,517 | $122,347 | $34,170 |
| 2014 | $1,977 | $153,452 | $119,951 | $33,501 |
Source: Public Records
Map
Nearby Homes
- 9929 Park St
- 9833 Walnut St
- 9833 Palm St
- 10117 Palm St
- 16712 Bellflower Blvd
- 10013 Flora Vista St
- 16414 Cornuta Ave Unit 8
- 16414 Cornuta Ave Unit 11
- 9719 Belmont St
- 16821 Ardmore Ave
- 9921 Flora Vista St Unit 5
- 9716 Oak St
- 10240 Artesia Blvd
- 9713 Cedar St
- 9928 Cedar St
- 9924 Cedar St
- 17625 Carpintero Ave Unit 62
- 17641 Windward Terrace
- 17046 Clark Ave
- 5549 Ashworth St
- 17045 Bixby Ave
- 17057 Bixby Ave
- 9955 Park St
- 17041 Bixby Ave
- 9947 Park St
- 17035 Bixby Ave
- 9939 Park St
- 17103 Bixby Ave
- 9946 Arkansas St
- 9936 Arkansas St
- 17107 Bixby Ave
- 9935 Park St
- 9946 Park St
- 10000 Park St
- 17023 Bixby Ave
- 10006 Park St
- 9932 Arkansas St
- 9940 Park St
- 17113 Bixby Ave
- 17019 Bixby Ave