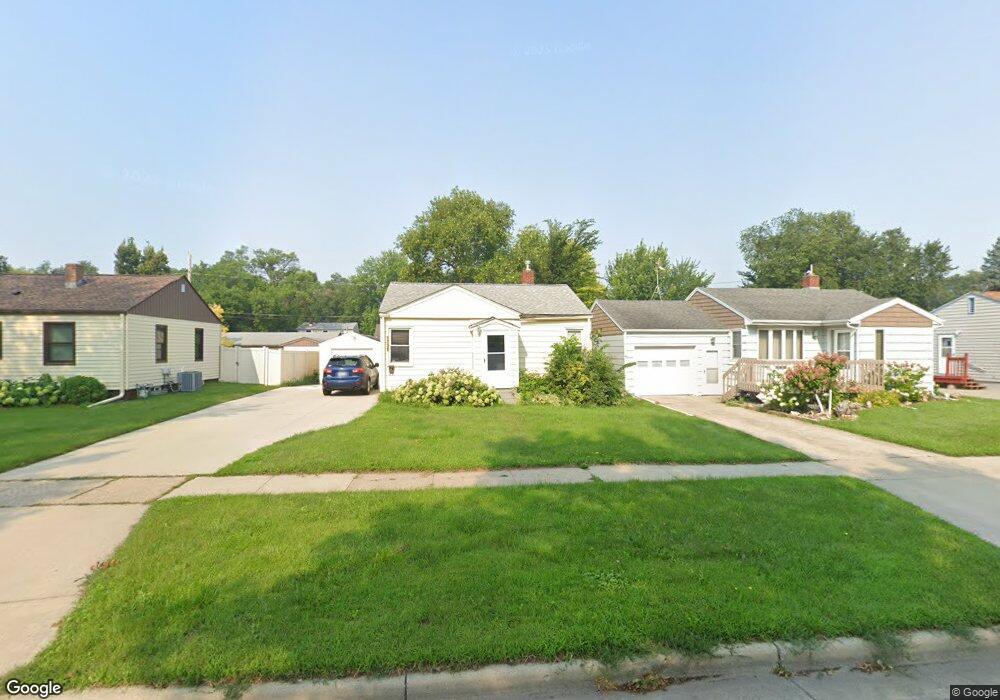
1706 3rd St N Fargo, ND 58102
Washington NeighborhoodEstimated Value: $202,000 - $248,000
3
Beds
1
Bath
1,960
Sq Ft
$113/Sq Ft
Est. Value
About This Home
This home is located at 1706 3rd St N, Fargo, ND 58102 and is currently estimated at $220,654, approximately $112 per square foot. 1706 3rd St N is a home located in Cass County with nearby schools including Washington Elementary School, Ben Franklin Middle School, and North High School.
Ownership History
Date
Name
Owned For
Owner Type
Purchase Details
Closed on
Jul 28, 2017
Sold by
Robson Ronald D and Robson Dawn A
Bought by
Lake Two Properties Llc
Current Estimated Value
Purchase Details
Closed on
Mar 25, 2016
Sold by
Duma Aaron J and Duma Emily
Bought by
Robson Ronald D and Robson Dawn A
Purchase Details
Closed on
Aug 27, 2012
Sold by
Kenowski Jamie and Kenowski Rachel N
Bought by
Duma Aaron J
Home Financials for this Owner
Home Financials are based on the most recent Mortgage that was taken out on this home.
Original Mortgage
$124,208
Interest Rate
3.5%
Mortgage Type
FHA
Purchase Details
Closed on
Sep 22, 2008
Sold by
Whittlesey Clay and Whittlesey Judy
Bought by
Kenowski Jamie and Kenowski Rachel N
Home Financials for this Owner
Home Financials are based on the most recent Mortgage that was taken out on this home.
Original Mortgage
$90,601
Interest Rate
6.52%
Mortgage Type
New Conventional
Create a Home Valuation Report for This Property
The Home Valuation Report is an in-depth analysis detailing your home's value as well as a comparison with similar homes in the area
Home Values in the Area
Average Home Value in this Area
Purchase History
| Date | Buyer | Sale Price | Title Company |
|---|---|---|---|
| Lake Two Properties Llc | -- | None Available | |
| Robson Ronald D | $156,000 | Fm Title | |
| Duma Aaron J | $126,000 | Fm Title | |
| Kenowski Jamie | -- | -- |
Source: Public Records
Mortgage History
| Date | Status | Borrower | Loan Amount |
|---|---|---|---|
| Previous Owner | Duma Aaron J | $124,208 | |
| Previous Owner | Kenowski Jamie | $90,601 |
Source: Public Records
Tax History
| Year | Tax Paid | Tax Assessment Tax Assessment Total Assessment is a certain percentage of the fair market value that is determined by local assessors to be the total taxable value of land and additions on the property. | Land | Improvement |
|---|---|---|---|---|
| 2024 | $3,614 | $107,600 | $19,200 | $88,400 |
| 2023 | $3,410 | $100,550 | $19,200 | $81,350 |
| 2022 | $3,402 | $98,600 | $19,200 | $79,400 |
| 2021 | $3,204 | $93,000 | $19,200 | $73,800 |
| 2020 | $3,054 | $88,550 | $19,200 | $69,350 |
| 2019 | $3,057 | $88,550 | $11,400 | $77,150 |
| 2018 | $2,680 | $75,650 | $11,400 | $64,250 |
| 2017 | $2,504 | $70,700 | $11,400 | $59,300 |
| 2016 | $2,201 | $64,250 | $11,400 | $52,850 |
| 2015 | $1,924 | $64,250 | $7,800 | $56,450 |
| 2014 | $1,874 | $60,700 | $7,800 | $52,900 |
| 2013 | $1,800 | $57,800 | $7,800 | $50,000 |
Source: Public Records
Map
Nearby Homes
- 77 18th Ave N
- 1830 4th St N
- 1647 Broadway N
- 3216 Broadway N
- 301 21st Ave N
- 1630 7th St N
- 801 17th Ave N
- 2001 8th St N
- 1441 Broadway N Unit 203
- 1437 Broadway N Unit 101
- 306 25th Ave N
- 105 24th Ave N
- 1613 10th St N
- 1345 4th St N
- 1625 11th St N
- 1626 11th St N
- 2501 9th St N
- 1306 Elm St N
- 1257 4th St N
- 1249 2nd St N
Your Personal Tour Guide
Ask me questions while you tour the home.