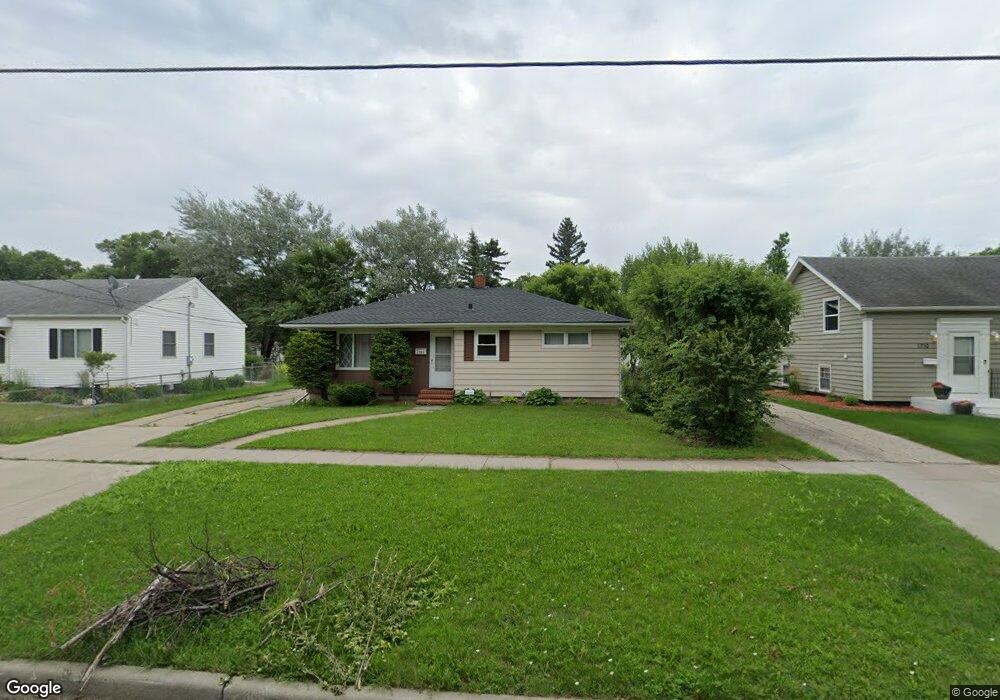
1706 4th Ave S Fargo, ND 58103
Jefferson-Carl NeighborhoodEstimated Value: $206,000 - $246,121
2
Beds
3
Baths
1,270
Sq Ft
$182/Sq Ft
Est. Value
About This Home
This home is located at 1706 4th Ave S, Fargo, ND 58103 and is currently estimated at $230,780, approximately $181 per square foot. 1706 4th Ave S is a home located in Cass County with nearby schools including Jefferson Elementary School, Ben Franklin Middle School, and South High School.
Ownership History
Date
Name
Owned For
Owner Type
Purchase Details
Closed on
Feb 18, 2011
Sold by
Evelyth Melanie R
Bought by
Treleaven David J
Current Estimated Value
Purchase Details
Closed on
Apr 29, 2010
Sold by
Kennedy Terrence L
Bought by
Treleaven David J and Treleaven Evelyth Melanie
Home Financials for this Owner
Home Financials are based on the most recent Mortgage that was taken out on this home.
Original Mortgage
$109,250
Interest Rate
5.02%
Mortgage Type
New Conventional
Purchase Details
Closed on
Sep 2, 2009
Sold by
Wachovia Bank Na
Bought by
Kennedy Torrence L
Home Financials for this Owner
Home Financials are based on the most recent Mortgage that was taken out on this home.
Original Mortgage
$67,500
Interest Rate
5.32%
Mortgage Type
Future Advance Clause Open End Mortgage
Create a Home Valuation Report for This Property
The Home Valuation Report is an in-depth analysis detailing your home's value as well as a comparison with similar homes in the area
Home Values in the Area
Average Home Value in this Area
Purchase History
| Date | Buyer | Sale Price | Title Company |
|---|---|---|---|
| Treleaven David J | -- | -- | |
| Treleaven David J | -- | -- | |
| Kennedy Torrence L | -- | -- |
Source: Public Records
Mortgage History
| Date | Status | Borrower | Loan Amount |
|---|---|---|---|
| Previous Owner | Treleaven David J | $109,250 | |
| Previous Owner | Kennedy Torrence L | $67,500 |
Source: Public Records
Tax History Compared to Growth
Tax History
| Year | Tax Paid | Tax Assessment Tax Assessment Total Assessment is a certain percentage of the fair market value that is determined by local assessors to be the total taxable value of land and additions on the property. | Land | Improvement |
|---|---|---|---|---|
| 2024 | $2,717 | $106,900 | $24,350 | $82,550 |
| 2023 | $3,040 | $100,850 | $24,350 | $76,500 |
| 2022 | $2,976 | $96,050 | $24,350 | $71,700 |
| 2021 | $2,750 | $89,350 | $24,350 | $65,000 |
| 2020 | $2,742 | $89,350 | $24,350 | $65,000 |
| 2019 | $2,577 | $83,850 | $14,450 | $69,400 |
| 2018 | $2,546 | $83,850 | $14,450 | $69,400 |
| 2017 | $2,522 | $83,850 | $14,450 | $69,400 |
| 2016 | $2,647 | $98,400 | $14,450 | $83,950 |
| 2015 | $2,310 | $78,850 | $9,900 | $68,950 |
| 2014 | $2,210 | $73,000 | $9,900 | $63,100 |
| 2013 | $2,101 | $69,500 | $9,900 | $59,600 |
Source: Public Records
Map
Nearby Homes