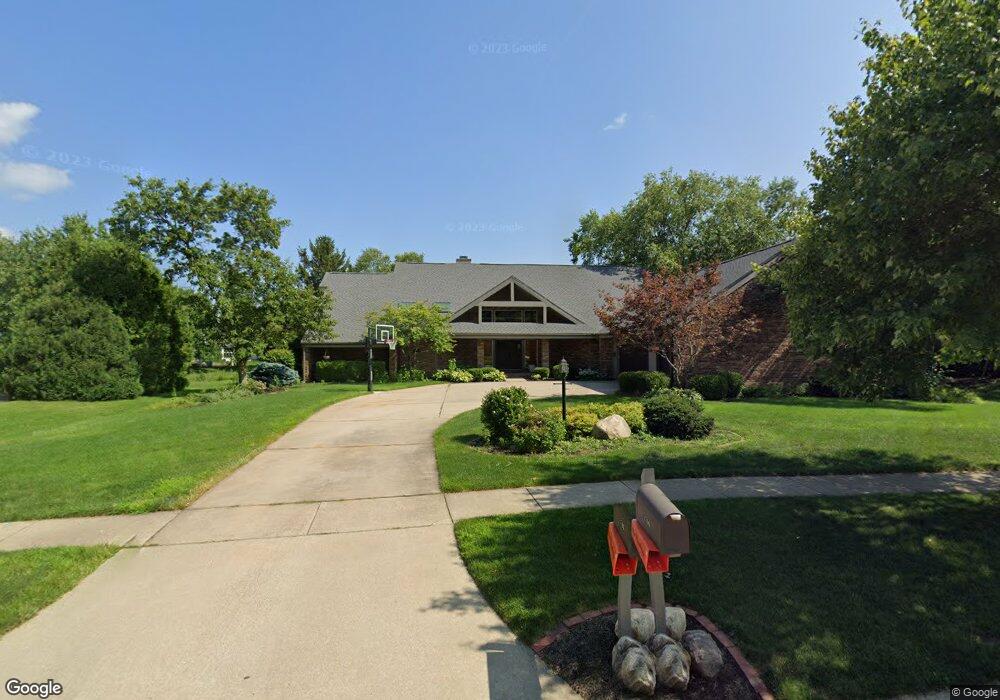
1706 Bentbrook Dr Unit 1 Champaign, IL 61822
Estimated Value: $653,204 - $743,000
4
Beds
4
Baths
4,021
Sq Ft
$178/Sq Ft
Est. Value
About This Home
This home is located at 1706 Bentbrook Dr Unit 1, Champaign, IL 61822 and is currently estimated at $713,801, approximately $177 per square foot. 1706 Bentbrook Dr Unit 1 is a home located in Champaign County with nearby schools including Centennial High School, Countryside School, and Swann Special Care Center-Elem/Secondary School.
Ownership History
Date
Name
Owned For
Owner Type
Purchase Details
Closed on
Sep 6, 2017
Sold by
Peirce John R and Peirce Lorene M
Bought by
Sehy Zachary J and Sehy Allyson B
Current Estimated Value
Purchase Details
Closed on
Mar 12, 2003
Sold by
Peirce John R
Bought by
Peirce John R and Peirce Lorene M
Home Financials for this Owner
Home Financials are based on the most recent Mortgage that was taken out on this home.
Original Mortgage
$322,700
Interest Rate
6%
Mortgage Type
Balloon
Purchase Details
Closed on
Mar 7, 2003
Sold by
Dye Edward and Dye Dale L
Bought by
Peirce John R
Home Financials for this Owner
Home Financials are based on the most recent Mortgage that was taken out on this home.
Original Mortgage
$322,700
Interest Rate
6%
Mortgage Type
Balloon
Create a Home Valuation Report for This Property
The Home Valuation Report is an in-depth analysis detailing your home's value as well as a comparison with similar homes in the area
Purchase History
| Date | Buyer | Sale Price | Title Company |
|---|---|---|---|
| Sehy Zachary J | $500,000 | Attorney | |
| Peirce John R | -- | -- | |
| Peirce John R | $460,000 | -- |
Source: Public Records
Mortgage History
| Date | Status | Borrower | Loan Amount |
|---|---|---|---|
| Previous Owner | Peirce John R | $322,700 |
Source: Public Records
Tax History
| Year | Tax Paid | Tax Assessment Tax Assessment Total Assessment is a certain percentage of the fair market value that is determined by local assessors to be the total taxable value of land and additions on the property. | Land | Improvement |
|---|---|---|---|---|
| 2024 | $13,277 | $202,300 | $73,740 | $128,560 |
| 2023 | $13,277 | $186,800 | $68,090 | $118,710 |
| 2022 | $12,688 | $174,260 | $63,520 | $110,740 |
| 2021 | $12,200 | $171,180 | $62,400 | $108,780 |
| 2020 | $12,100 | $169,480 | $61,780 | $107,700 |
| 2019 | $11,713 | $166,650 | $60,750 | $105,900 |
| 2018 | $11,699 | $166,650 | $60,750 | $105,900 |
| 2017 | $13,496 | $191,090 | $60,750 | $130,340 |
| 2016 | $11,681 | $184,970 | $60,750 | $124,220 |
| 2015 | $10,848 | $184,970 | $60,750 | $124,220 |
| 2014 | $10,753 | $167,610 | $60,750 | $106,860 |
| 2013 | $10,572 | $167,610 | $60,750 | $106,860 |
Source: Public Records
Map
Nearby Homes
- 1914 Trout Valley Dr
- 1914 Woodfield Rd
- 4203 Curtis Meadow Dr
- 4002 Lakepoint Rd
- 4007 Turnberry Dr
- 3120 Moraine Dr
- 3906 Crail Rd
- 4406 Crossgate Dr
- 4309 Stonebridge Ct
- 4111 Farhills Dr
- 3510 S Duncan Rd
- 4703 W Kirby Ave
- 1309 Maplepark Dr
- 2010 Strand Dr
- 1818 Benodot St
- 7 Briar Hill Cir Unit G
- 1610 Stratford Dr
- 2812 Alton Dr
- 2704 W Kirby Ave
- 2605 Trafalgar Square
- 1706 Bentbrook Dr
- 1708 Bentbrook Dr
- 1704 Bentbrook Dr
- 1805 Byrnebruk Dr
- 1702 Bentbrook Dr
- 1710 Bentbrook Dr
- 1705 Bentbrook Dr
- 1707 Bentbrook Dr
- 1803 Byrnebruk Dr
- 1701 Bentbrook Dr
- 1604 Bentbrook Dr
- 1712 Bentbrook Dr
- 1709 Bentbrook Dr
- 1801 Byrnebruk Dr
- 1607 Bentbrook Ct
- 1602 Bentbrook Dr
- 1711 Bentbrook Dr
- 1901 Trout Valley Dr
- 1714 Bentbrook Dr
- 1608 Bentbrook Ct
Your Personal Tour Guide
Ask me questions while you tour the home.