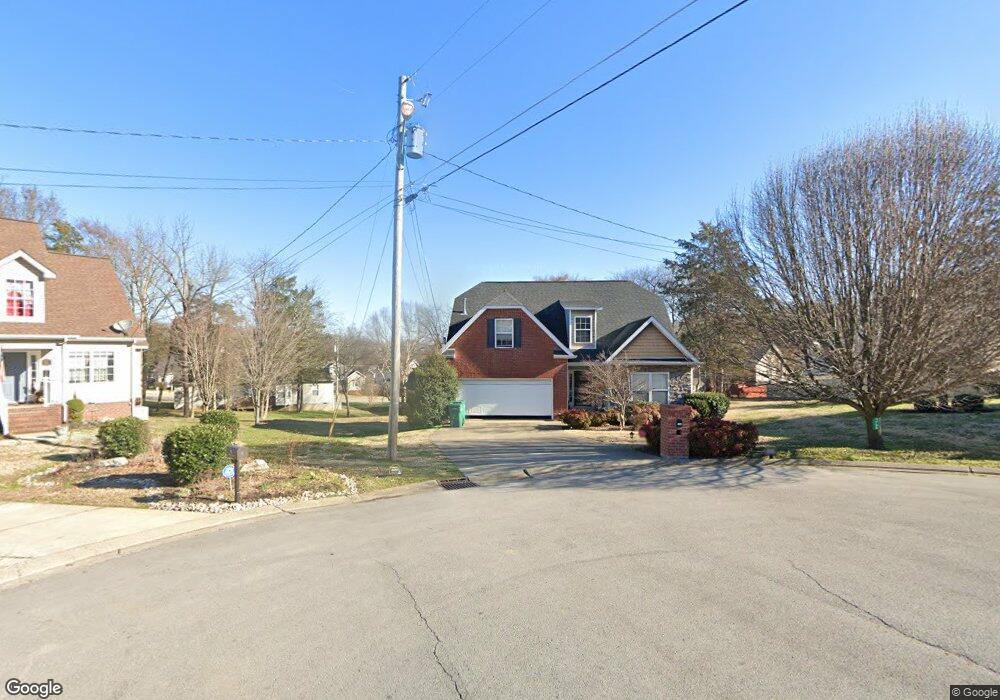
1706 Briarhill Ct La Vergne, TN 37086
Estimated Value: $386,251 - $444,000
--
Bed
3
Baths
2,091
Sq Ft
$198/Sq Ft
Est. Value
About This Home
This home is located at 1706 Briarhill Ct, La Vergne, TN 37086 and is currently estimated at $413,563, approximately $197 per square foot. 1706 Briarhill Ct is a home located in Rutherford County with nearby schools including Rock Springs Elementary School, Rock Springs Middle School, and Stewarts Creek High School.
Ownership History
Date
Name
Owned For
Owner Type
Purchase Details
Closed on
Aug 2, 2021
Sold by
Crowe Ulysses L and Crowe Valerie H
Bought by
Crowe Ulysses L and Crowe Valerie H
Current Estimated Value
Home Financials for this Owner
Home Financials are based on the most recent Mortgage that was taken out on this home.
Original Mortgage
$180,000
Outstanding Balance
$136,973
Interest Rate
2.3%
Mortgage Type
New Conventional
Estimated Equity
$276,590
Purchase Details
Closed on
Jun 8, 2004
Sold by
Neal Construction Co
Bought by
Hamlett Valerie J
Home Financials for this Owner
Home Financials are based on the most recent Mortgage that was taken out on this home.
Original Mortgage
$161,405
Interest Rate
5.98%
Purchase Details
Closed on
Nov 18, 2003
Sold by
Bob Parks
Bought by
Neal Construction Co
Home Financials for this Owner
Home Financials are based on the most recent Mortgage that was taken out on this home.
Original Mortgage
$135,200
Interest Rate
6.04%
Create a Home Valuation Report for This Property
The Home Valuation Report is an in-depth analysis detailing your home's value as well as a comparison with similar homes in the area
Home Values in the Area
Average Home Value in this Area
Purchase History
| Date | Buyer | Sale Price | Title Company |
|---|---|---|---|
| Crowe Ulysses L | -- | Victory Title & Escrow Llc | |
| Hamlett Valerie J | $169,900 | -- | |
| Neal Construction Co | $32,900 | -- |
Source: Public Records
Mortgage History
| Date | Status | Borrower | Loan Amount |
|---|---|---|---|
| Open | Crowe Ulysses L | $180,000 | |
| Closed | Neal Construction Co | $161,405 | |
| Previous Owner | Neal Construction Co | $135,200 |
Source: Public Records
Tax History Compared to Growth
Tax History
| Year | Tax Paid | Tax Assessment Tax Assessment Total Assessment is a certain percentage of the fair market value that is determined by local assessors to be the total taxable value of land and additions on the property. | Land | Improvement |
|---|---|---|---|---|
| 2025 | $2,064 | $85,525 | $13,750 | $71,775 |
| 2024 | $2,064 | $85,525 | $13,750 | $71,775 |
| 2023 | $1,605 | $85,525 | $13,750 | $71,775 |
| 2022 | $1,382 | $85,525 | $13,750 | $71,775 |
| 2021 | $1,377 | $62,025 | $12,500 | $49,525 |
| 2020 | $1,377 | $62,025 | $12,500 | $49,525 |
| 2019 | $1,377 | $62,025 | $12,500 | $49,525 |
| 2018 | $1,742 | $62,025 | $0 | $0 |
| 2017 | $1,665 | $45,850 | $0 | $0 |
| 2016 | $1,665 | $45,850 | $0 | $0 |
| 2015 | $1,676 | $45,850 | $0 | $0 |
| 2014 | $1,140 | $45,850 | $0 | $0 |
| 2013 | -- | $47,450 | $0 | $0 |
Source: Public Records
Map
Nearby Homes
- 831 Briargrove Dr
- 112 Vanguard Dr
- 118 Vanguard Dr
- 128 Vanguard Dr
- 124 Vanguard Dr
- 126 Vanguard Dr
- 116 Vanguard Dr
- 122 Vanguard Dr
- 108 Vanguard Dr
- 110 Vanguard Dr
- 114 Vanguard Dr
- Johnson Plan at Mission Hills
- Sherwood Plan at Mission Hills
- Chatham Plan at Mission Hills
- Dakota Plan at Mission Hills
- Carolina Plan at Mission Hills
- Gibson Plan at Mission Hills
- 400 Blair Rd
- Markham Plan at Portico
- 414 Blair Rd
- 1704 Briarhill Ct
- 1707 Briarhill Ct
- 1230 Highland Hills Dr
- 1228 Highland Hills Dr
- 638 Woodland Hills Dr
- 636 Woodland Hills Dr
- 1705 Briarhill Ct
- 1702 Briarhill Ct
- 1226 Highland Hills Dr
- 634 Woodland Hills Dr
- 1703 Briarhill Ct
- 1606 Twin Ledge Ct
- 642 Woodland Hills Dr
- 1604 Twin Ledge Ct
- 1224 Highland Hills Dr
- 1227 Highland Hills Dr
- 1700 Briarhill Ct
- 1555 Laurel Ledge Dr
- 1225 Highland Hills Dr
- 1563 Laurel Ledge Dr