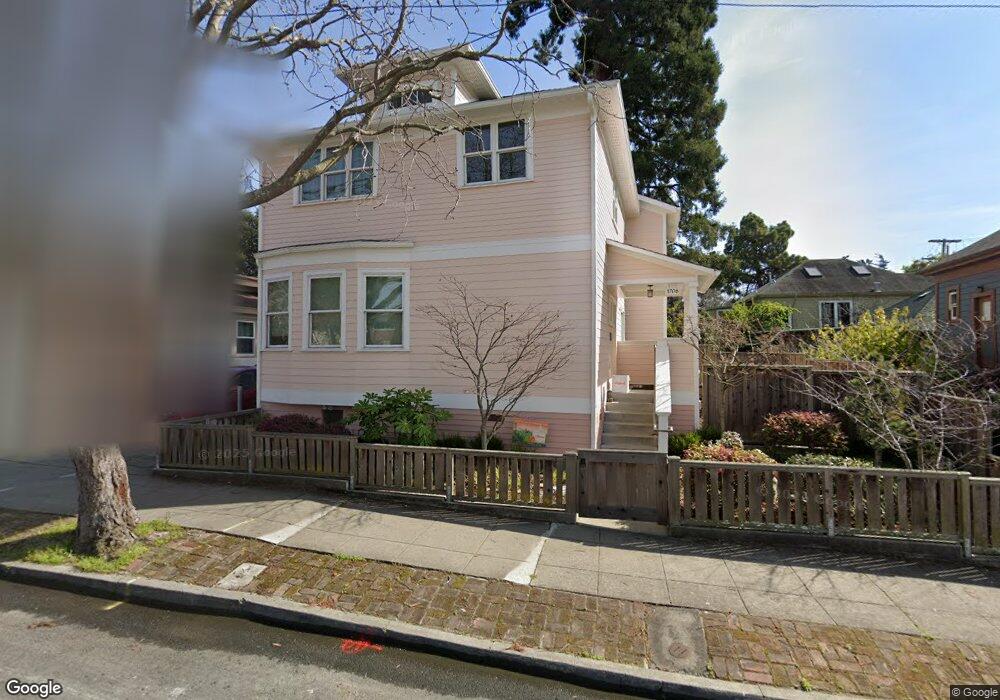
1706 Delaware St Berkeley, CA 94703
North Berkeley NeighborhoodEstimated Value: $1,398,000 - $1,821,000
4
Beds
2
Baths
1,760
Sq Ft
$930/Sq Ft
Est. Value
About This Home
This home is located at 1706 Delaware St, Berkeley, CA 94703 and is currently estimated at $1,637,294, approximately $930 per square foot. 1706 Delaware St is a home located in Alameda County with nearby schools including Berkeley Arts Magnet at Whittier School, Washington Elementary School, and Oxford Elementary School.
Ownership History
Date
Name
Owned For
Owner Type
Purchase Details
Closed on
Jul 25, 2012
Sold by
Coffey Anette N
Bought by
Coffey Annette N and The Annette N Coffey Revocable
Current Estimated Value
Home Financials for this Owner
Home Financials are based on the most recent Mortgage that was taken out on this home.
Original Mortgage
$390,000
Interest Rate
3.65%
Mortgage Type
New Conventional
Purchase Details
Closed on
Oct 12, 2009
Sold by
Coffey Annette N
Bought by
Coffey Annette N and The Annette N Coffey Revocable
Home Financials for this Owner
Home Financials are based on the most recent Mortgage that was taken out on this home.
Original Mortgage
$404,000
Interest Rate
5.01%
Mortgage Type
New Conventional
Purchase Details
Closed on
Nov 21, 2007
Sold by
Coffey Annette N
Bought by
Liv Coffey Annette N and Liv Annette N Coffey Revocable
Create a Home Valuation Report for This Property
The Home Valuation Report is an in-depth analysis detailing your home's value as well as a comparison with similar homes in the area
Home Values in the Area
Average Home Value in this Area
Purchase History
| Date | Buyer | Sale Price | Title Company |
|---|---|---|---|
| Coffey Annette N | -- | Old Republic Title Company | |
| Coffee Annette N | -- | Old Republic Title Company | |
| Coffey Annette N | -- | Old Republic Title Company | |
| Coffey Annette N | -- | Old Republic Title Company | |
| Liv Coffey Annette N | -- | None Available |
Source: Public Records
Mortgage History
| Date | Status | Borrower | Loan Amount |
|---|---|---|---|
| Closed | Coffee Annette N | $390,000 | |
| Closed | Coffey Annette N | $404,000 |
Source: Public Records
Tax History
| Year | Tax Paid | Tax Assessment Tax Assessment Total Assessment is a certain percentage of the fair market value that is determined by local assessors to be the total taxable value of land and additions on the property. | Land | Improvement |
|---|---|---|---|---|
| 2025 | $9,536 | $482,774 | $110,383 | $379,391 |
| 2024 | $9,536 | $473,172 | $108,219 | $371,953 |
| 2023 | $9,263 | $470,758 | $106,097 | $364,661 |
| 2022 | $9,000 | $454,529 | $104,017 | $357,512 |
| 2021 | $8,996 | $445,480 | $101,977 | $350,503 |
| 2020 | $8,452 | $447,842 | $100,932 | $346,910 |
| 2019 | $8,044 | $439,063 | $98,953 | $340,110 |
| 2018 | $7,876 | $430,457 | $97,014 | $333,443 |
| 2017 | $7,592 | $422,018 | $95,112 | $326,906 |
| 2016 | $7,281 | $413,743 | $93,247 | $320,496 |
| 2015 | $7,167 | $407,529 | $91,846 | $315,683 |
| 2014 | $7,081 | $399,549 | $90,048 | $309,501 |
Source: Public Records
Map
Nearby Homes
- 1716 Hearst Ave
- 1808 Cedar St
- 2112 Mckinley Ave Unit D
- 1625 Martin Luther King jr Way
- 2218 -2222 Grant St
- 2118 California St
- 1609 Bonita Ave Unit 5
- 1610 Milvia St
- 1578 Allston Way
- 1718 Bancroft Way
- 1425 Martin Luther King jr Way
- 1368 Rose St
- 1682 Oxford St
- 1322 Virginia St
- 2201 Virginia St Unit 2
- 1408 Henry St
- 1626 Hopkins St
- 1739 Spruce St
- 1444 Walnut St
- 1929 Haste St
- 1803 McGee Ave
- 1801 McGee Ave
- 1710 Delaware St
- 1805 McGee Ave
- 1716 Delaware St
- 1716 Delaware St
- 1716 Delaware St
- 1705 Delaware St
- 1701 Delaware St
- 1811 McGee Ave
- 1709 Delaware St
- 1715 Delaware St
- 1808 McGee Ave
- 1743 McGee Ave
- 1724 Delaware St
- 1717 Delaware St
- 1642 Delaware St
- 1719 Delaware St
- 1739 McGee Ave
- 1744 McGee Ave
Your Personal Tour Guide
Ask me questions while you tour the home.