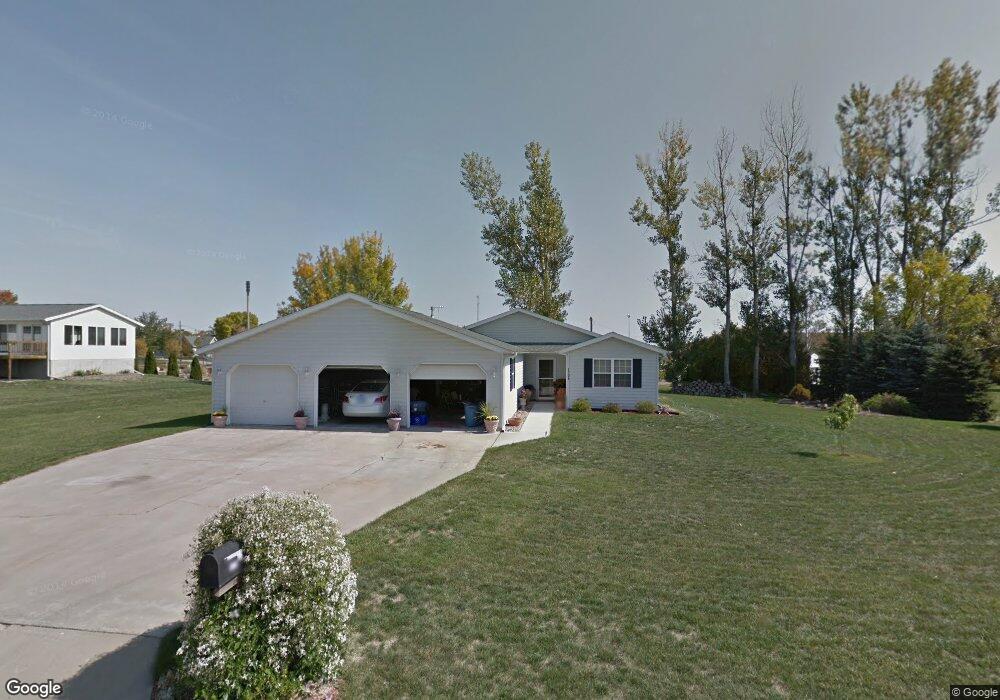
1706 E Ave Vinton, IA 52349
Estimated Value: $232,443 - $272,000
2
Beds
2
Baths
1,644
Sq Ft
$151/Sq Ft
Est. Value
About This Home
This home is located at 1706 E Ave, Vinton, IA 52349 and is currently estimated at $248,861, approximately $151 per square foot. 1706 E Ave is a home located in Benton County with nearby schools including Tilford Elementary School, Shellsburg Elementary School, and Vinton-Shellsburg Middle School.
Ownership History
Date
Name
Owned For
Owner Type
Purchase Details
Closed on
Aug 1, 2014
Sold by
Boldra Philip D
Bought by
Shafer John James and Shafer Theresa K
Current Estimated Value
Home Financials for this Owner
Home Financials are based on the most recent Mortgage that was taken out on this home.
Original Mortgage
$110,800
Outstanding Balance
$60,386
Interest Rate
4.19%
Mortgage Type
Future Advance Clause Open End Mortgage
Estimated Equity
$188,475
Create a Home Valuation Report for This Property
The Home Valuation Report is an in-depth analysis detailing your home's value as well as a comparison with similar homes in the area
Home Values in the Area
Average Home Value in this Area
Purchase History
| Date | Buyer | Sale Price | Title Company |
|---|---|---|---|
| Shafer John James | $138,625 | None Available |
Source: Public Records
Mortgage History
| Date | Status | Borrower | Loan Amount |
|---|---|---|---|
| Open | Shafer John James | $110,800 |
Source: Public Records
Tax History Compared to Growth
Tax History
| Year | Tax Paid | Tax Assessment Tax Assessment Total Assessment is a certain percentage of the fair market value that is determined by local assessors to be the total taxable value of land and additions on the property. | Land | Improvement |
|---|---|---|---|---|
| 2025 | $3,020 | $200,300 | $40,700 | $159,600 |
| 2024 | $3,020 | $185,100 | $40,100 | $145,000 |
| 2023 | $3,046 | $185,100 | $40,100 | $145,000 |
| 2022 | $3,124 | $150,400 | $32,100 | $118,300 |
| 2021 | $3,124 | $150,400 | $32,100 | $118,300 |
| 2020 | $2,984 | $146,700 | $24,200 | $122,500 |
| 2019 | $2,992 | $146,700 | $24,200 | $122,500 |
| 2018 | $2,902 | $145,000 | $23,100 | $121,900 |
| 2017 | $2,786 | $145,000 | $23,100 | $121,900 |
| 2016 | $2,736 | $135,500 | $21,600 | $113,900 |
| 2015 | $2,736 | $135,500 | $21,600 | $113,900 |
| 2014 | $2,834 | $139,800 | $0 | $0 |
Source: Public Records
Map
Nearby Homes