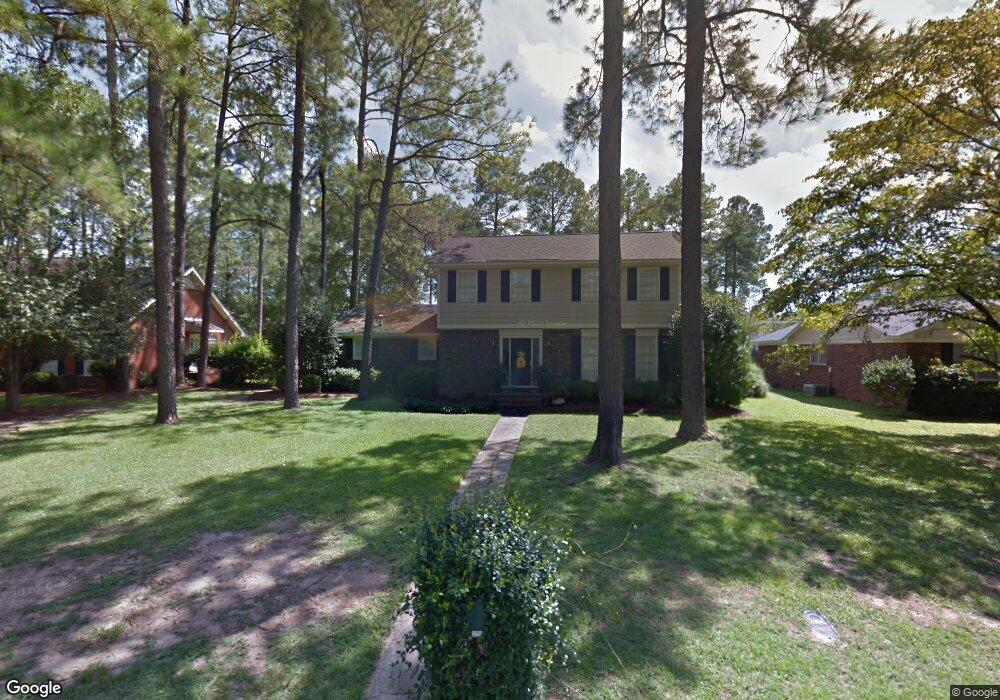
1706 Myrtle Rd Albany, GA 31707
Merry Acres NeighborhoodEstimated Value: $152,000 - $185,000
4
Beds
3
Baths
1,666
Sq Ft
$97/Sq Ft
Est. Value
About This Home
This home is located at 1706 Myrtle Rd, Albany, GA 31707 and is currently estimated at $161,553, approximately $96 per square foot. 1706 Myrtle Rd is a home located in Dougherty County with nearby schools including Live Oak Elementary School, Merry Acres Middle School, and Westover High School.
Ownership History
Date
Name
Owned For
Owner Type
Purchase Details
Closed on
May 21, 2021
Sold by
Thornhill Jason B
Bought by
Thornhill Kelley Nichole and Thornhill Bentley Reed
Current Estimated Value
Home Financials for this Owner
Home Financials are based on the most recent Mortgage that was taken out on this home.
Original Mortgage
$93,279
Outstanding Balance
$84,268
Interest Rate
2.9%
Mortgage Type
FHA
Estimated Equity
$77,285
Purchase Details
Closed on
Jun 27, 1997
Sold by
Puckett Ben and Puckett Regina
Bought by
Thornhill Jason B Daphne K
Purchase Details
Closed on
Aug 28, 1995
Sold by
Burkhalter Tracy G Fka Benton
Bought by
Puckett Ben and Puckett Regina
Purchase Details
Closed on
Sep 7, 1990
Sold by
Bolton Virginia D
Bought by
Benton Tracy G
Purchase Details
Closed on
Nov 7, 1989
Sold by
Tomilinson Dennis
Bought by
Bolton Virginia D
Create a Home Valuation Report for This Property
The Home Valuation Report is an in-depth analysis detailing your home's value as well as a comparison with similar homes in the area
Home Values in the Area
Average Home Value in this Area
Purchase History
| Date | Buyer | Sale Price | Title Company |
|---|---|---|---|
| Thornhill Kelley Nichole | $95,000 | -- | |
| Thornhill Jason B Daphne K | $91,200 | -- | |
| Puckett Ben | $77,300 | -- | |
| Benton Tracy G | $71,000 | -- | |
| Bolton Virginia D | $78,600 | -- |
Source: Public Records
Mortgage History
| Date | Status | Borrower | Loan Amount |
|---|---|---|---|
| Open | Thornhill Kelley Nichole | $93,279 |
Source: Public Records
Tax History Compared to Growth
Tax History
| Year | Tax Paid | Tax Assessment Tax Assessment Total Assessment is a certain percentage of the fair market value that is determined by local assessors to be the total taxable value of land and additions on the property. | Land | Improvement |
|---|---|---|---|---|
| 2024 | $1,884 | $39,480 | $7,440 | $32,040 |
| 2023 | $1,839 | $39,480 | $7,440 | $32,040 |
| 2022 | $1,777 | $39,480 | $7,440 | $32,040 |
| 2021 | $1,625 | $39,480 | $7,440 | $32,040 |
| 2020 | $1,629 | $39,480 | $7,440 | $32,040 |
| 2019 | $1,635 | $39,480 | $7,440 | $32,040 |
| 2018 | $1,642 | $39,480 | $7,440 | $32,040 |
| 2017 | $1,529 | $39,480 | $7,440 | $32,040 |
| 2016 | $1,530 | $39,480 | $7,440 | $32,040 |
| 2015 | $1,535 | $39,480 | $7,440 | $32,040 |
| 2014 | $1,515 | $39,480 | $7,440 | $32,040 |
Source: Public Records
Map
Nearby Homes
- 1710 Myrtle Rd
- 1711 Parker Ave
- 410 Pinecrest Dr
- 520 Baldwin Dr
- 511 Baldwin Dr
- 1821 Samford Ave
- 612 Russell Rd
- 600 N Ingleside Dr
- 608 Russell Rd
- 1603 Maryland Dr
- 1705 Lynwood Ln
- 2026 Melrose Dr
- 1708 Marbury Ln
- 1703 W Oglethorpe Ave
- 200 N Ingleside Dr
- 1157 Gillionville Rd
- 1714 Marbury Ln
- 1155 Gillionville Rd
- 1512 W 2nd Ave
- 405 Lucille St
- 1704 Myrtle Rd
- 1702 Myrtle Rd
- 1707 Parker Ave
- 1709 Parker Ave
- 1705 Parker Ave
- 1707 Myrtle Rd
- 1705 Myrtle Rd
- 1709 Myrtle Rd
- 1717 Myrtle Rd
- 1703 Parker Ave
- 1712 Myrtle Rd
- 1700 Myrtle Rd
- 1703 Myrtle Rd
- 0 Parker Ave Unit 7404345
- 1711 Myrtle Rd
- 1713 Parker Ave
- 1701 Parker Ave
- 1701 Myrtle Rd
- 1714 Myrtle Rd
- 1713 Myrtle Rd