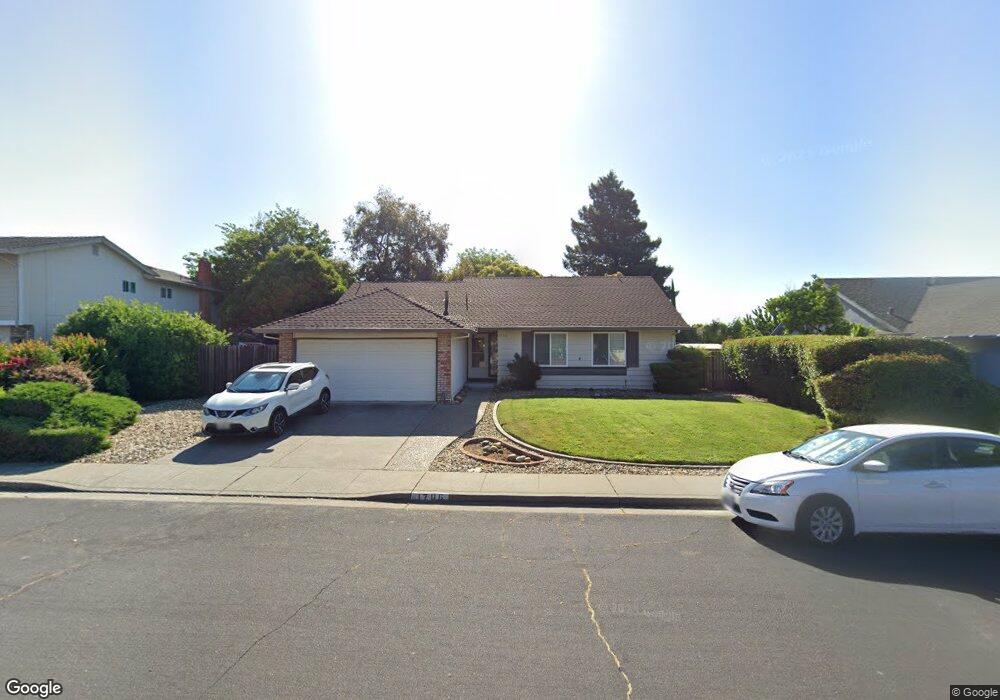
1706 Newburgh Ct Fairfield, CA 94534
Estimated Value: $558,973 - $608,000
3
Beds
2
Baths
1,471
Sq Ft
$396/Sq Ft
Est. Value
About This Home
This home is located at 1706 Newburgh Ct, Fairfield, CA 94534 and is currently estimated at $581,993, approximately $395 per square foot. 1706 Newburgh Ct is a home located in Solano County with nearby schools including K. I. Jones Elementary School, Angelo Rodriguez High School, and Solano Christian Academy.
Ownership History
Date
Name
Owned For
Owner Type
Purchase Details
Closed on
Jul 27, 2018
Sold by
Walton Diane M and Diane Haug Marcolini Family Tr
Bought by
Walton David J and Walton Diane M
Current Estimated Value
Purchase Details
Closed on
Mar 14, 2013
Sold by
Marcolini Diane M
Bought by
Marcolini Diane M
Home Financials for this Owner
Home Financials are based on the most recent Mortgage that was taken out on this home.
Original Mortgage
$255,781
Outstanding Balance
$180,416
Interest Rate
3.53%
Mortgage Type
FHA
Estimated Equity
$401,577
Purchase Details
Closed on
Mar 11, 2013
Sold by
Covey Robert C
Bought by
Marcolini Diane M
Home Financials for this Owner
Home Financials are based on the most recent Mortgage that was taken out on this home.
Original Mortgage
$255,781
Outstanding Balance
$180,416
Interest Rate
3.53%
Mortgage Type
FHA
Estimated Equity
$401,577
Purchase Details
Closed on
May 18, 2000
Sold by
Covey Robert C
Bought by
Covey Robert C
Create a Home Valuation Report for This Property
The Home Valuation Report is an in-depth analysis detailing your home's value as well as a comparison with similar homes in the area
Purchase History
| Date | Buyer | Sale Price | Title Company |
|---|---|---|---|
| Walton David J | -- | None Available | |
| Marcolini Diane M | $265,000 | None Available | |
| Marcolini Diane M | $265,000 | Placer Title Company | |
| Covey Robert C | -- | -- |
Source: Public Records
Mortgage History
| Date | Status | Borrower | Loan Amount |
|---|---|---|---|
| Open | Marcolini Diane M | $255,781 |
Source: Public Records
Tax History
| Year | Tax Paid | Tax Assessment Tax Assessment Total Assessment is a certain percentage of the fair market value that is determined by local assessors to be the total taxable value of land and additions on the property. | Land | Improvement |
|---|---|---|---|---|
| 2025 | $3,655 | $326,317 | $73,879 | $252,438 |
| 2024 | $3,655 | $319,920 | $72,431 | $247,489 |
| 2023 | $3,543 | $313,648 | $71,011 | $242,637 |
| 2022 | $3,500 | $307,499 | $69,620 | $237,879 |
| 2021 | $3,466 | $301,470 | $68,255 | $233,215 |
| 2020 | $3,385 | $298,380 | $67,556 | $230,824 |
| 2019 | $3,302 | $292,531 | $66,232 | $226,299 |
| 2018 | $3,408 | $286,796 | $64,934 | $221,862 |
| 2017 | $3,251 | $281,173 | $63,661 | $217,512 |
| 2016 | $3,225 | $275,661 | $62,413 | $213,248 |
| 2015 | $3,010 | $271,521 | $61,476 | $210,045 |
| 2014 | $2,983 | $266,203 | $60,272 | $205,931 |
Source: Public Records
Map
Nearby Homes
- 1518 Astoria Dr
- 3451 Nantucket Dr
- 3456 Norwalk Place
- 1437 Shelby Dr
- 3511 Norwalk Place
- 2810 Miller Ct
- 2903 Burbank Dr
- 2848 Howe Ct
- 1866 New Jersey St
- 185 Canby Way
- 1949 New Jersey St
- 2125 Mecca Ct
- 3114 Lomita Ct
- 1654 Minnesota St
- 1837 Vermont St
- 1858 Barbour Dr
- 1625 Minnesota St
- 1745 Utah St
- 1318 Cleveland St
- 2045 Dorland Dr
- 1712 Newburgh Ct
- 1700 Newburgh Ct
- 3218 Niagara Way
- 3224 Niagara Way
- 1717 Wayne Ct
- 3384 Ticonderoga Dr
- 1718 Newburgh Ct
- 1709 Newburgh Ct
- 3212 Niagara Way
- 1724 Newburgh Ct
- 3377 Ticonderoga Dr
- 1715 Newburgh Ct
- 3390 Ticonderoga Dr
- 1726 Wayne Ct
- 3371 Ticonderoga Dr
- 1699 Newburgh Dr
- 1721 Newburgh Ct
- 3362 Ticonderoga Dr
- 3365 Ticonderoga Dr
- 1708 Astoria Dr
Your Personal Tour Guide
Ask me questions while you tour the home.