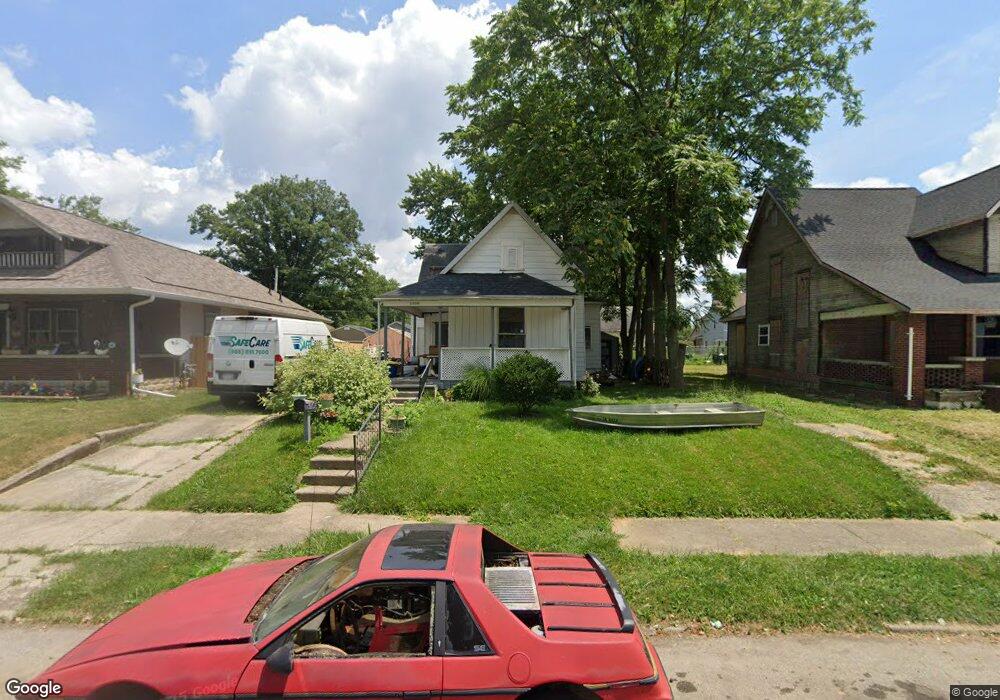
1706 S Mulberry St Muncie, IN 47302
South Central NeighborhoodEstimated Value: $61,076 - $102,000
3
Beds
1
Bath
904
Sq Ft
$81/Sq Ft
Est. Value
About This Home
This home is located at 1706 S Mulberry St, Muncie, IN 47302 and is currently estimated at $73,519, approximately $81 per square foot. 1706 S Mulberry St is a home located in Delaware County with nearby schools including South View Elementary School, Muncie Central High School, and Southside Middle School.
Ownership History
Date
Name
Owned For
Owner Type
Purchase Details
Closed on
Jan 25, 2021
Sold by
Rawlings Patricia and Foy Jeffrey
Bought by
Foy Jeffrey
Current Estimated Value
Purchase Details
Closed on
Nov 2, 2016
Sold by
Foy Jeffrey and Foy Teresa
Bought by
Rawlings Patricia and Foy Jeffrey
Purchase Details
Closed on
Jul 18, 2014
Sold by
Star Properties Llc
Bought by
Foy Jeffrey and Foy Teresa
Purchase Details
Closed on
Nov 1, 2012
Sold by
Epps Stowers Charlotte N
Bought by
Star Properties Llc
Purchase Details
Closed on
Jan 2, 2007
Sold by
Penny Foreclosures Iii Llc
Bought by
Epps Stowers Charlotte N
Purchase Details
Closed on
Sep 15, 2006
Sold by
Federal National Mortgage Association
Bought by
Penny Forclosures Llc
Purchase Details
Closed on
Jun 23, 2006
Sold by
Federal National Mortgage Association
Bought by
Penny Forclosures Llc
Purchase Details
Closed on
Sep 28, 2005
Sold by
Davis Patrick W and Davis Kristi K
Bought by
Federal National Mortgage Association
Create a Home Valuation Report for This Property
The Home Valuation Report is an in-depth analysis detailing your home's value as well as a comparison with similar homes in the area
Home Values in the Area
Average Home Value in this Area
Purchase History
| Date | Buyer | Sale Price | Title Company |
|---|---|---|---|
| Foy Jeffrey | -- | None Available | |
| Rawlings Patricia | -- | -- | |
| Foy Jeffrey | -- | -- | |
| Star Properties Llc | $500 | None Available | |
| Epps Stowers Charlotte N | -- | None Available | |
| Penny Forclosures Llc | -- | None Available | |
| Penny Forclosures Llc | -- | Anchor Title | |
| Federal National Mortgage Association | -- | None Available |
Source: Public Records
Tax History Compared to Growth
Tax History
| Year | Tax Paid | Tax Assessment Tax Assessment Total Assessment is a certain percentage of the fair market value that is determined by local assessors to be the total taxable value of land and additions on the property. | Land | Improvement |
|---|---|---|---|---|
| 2024 | $600 | $24,600 | $6,500 | $18,100 |
| 2023 | $560 | $22,600 | $5,400 | $17,200 |
| 2022 | $851 | $21,300 | $5,400 | $15,900 |
| 2021 | $108 | $16,800 | $3,600 | $13,200 |
| 2020 | $108 | $19,200 | $6,000 | $13,200 |
| 2019 | $108 | $20,600 | $6,000 | $14,600 |
| 2018 | $574 | $20,600 | $6,000 | $14,600 |
| 2017 | $530 | $21,100 | $6,500 | $14,600 |
| 2016 | $530 | $21,100 | $6,500 | $14,600 |
| 2014 | $519 | $23,800 | $7,300 | $16,500 |
| 2013 | -- | $23,600 | $7,300 | $16,300 |
Source: Public Records
Map
Nearby Homes
- 1702 S High St
- 1715 S Madison St
- 208 E 8th St
- 218 E 8th St
- 1911 S Walnut St
- 2004 S Walnut St
- 221 E 6th St
- 226 E 16th St
- 514 W Memorial Dr
- 1303 S Liberty St
- 605 W 10th St
- 2307 S Jefferson St
- 1011 S Elm St
- 429 W 6th St
- 2316 S Walnut St
- 1921 S Hackley St
- 623 E Willard St
- 706 W 11th St
- 1325 S Hoyt Ave
- 2115 S Ebright St
- 1702 S Mulberry St
- 1708 S Mulberry St
- 1700 S Mulberry St
- 1712 S Mulberry St
- 1705 S Jefferson St
- 1701 S Jefferson St
- 1709 S Jefferson St
- 1718 S Mulberry St
- 1624 S Mulberry St
- 1625 S Jefferson St
- 1713 S Jefferson St
- 1707 S Mulberry St
- 1713 1/2 S Jefferson St
- 1703 S Mulberry St
- 1711 S Mulberry St
- 1622 S Mulberry St
- 1623 S Jefferson St
- 1627 S Mulberry St
- 1715 S Mulberry St
- 1726 S Mulberry St