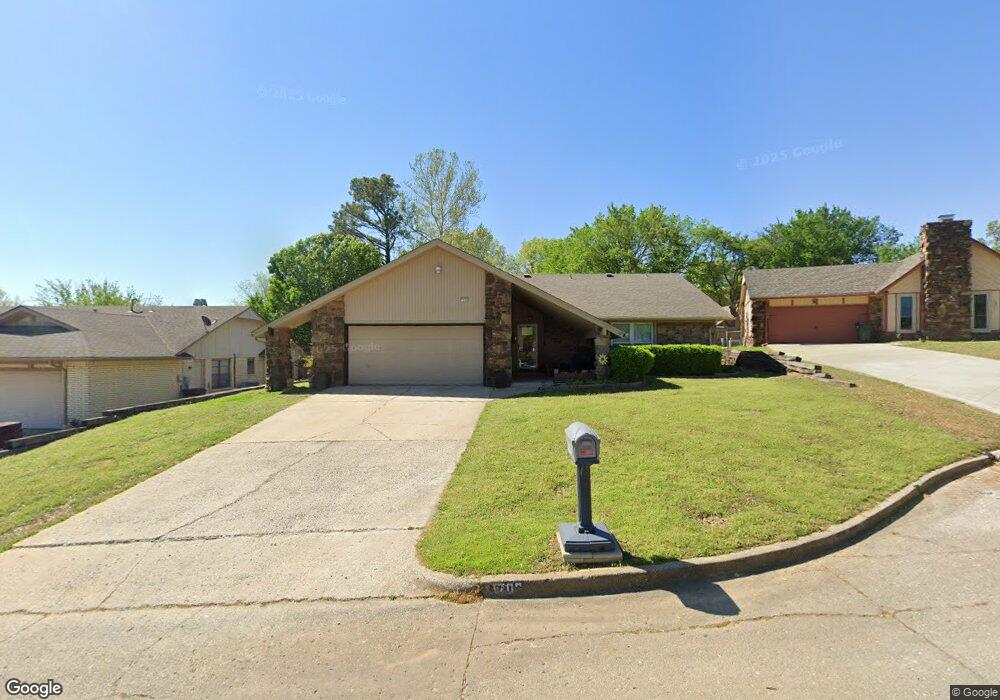
1706 Timberton Rd Sapulpa, OK 74066
Estimated Value: $231,477 - $278,000
3
Beds
2
Baths
1,740
Sq Ft
$147/Sq Ft
Est. Value
About This Home
This home is located at 1706 Timberton Rd, Sapulpa, OK 74066 and is currently estimated at $256,119, approximately $147 per square foot. 1706 Timberton Rd is a home located in Creek County with nearby schools including Sapulpa Middle School, Sapulpa Junior High School, and Sapulpa High School.
Ownership History
Date
Name
Owned For
Owner Type
Purchase Details
Closed on
Apr 27, 2018
Sold by
Lay Edwin C and Lay Nancy
Bought by
Rodriguez David
Current Estimated Value
Home Financials for this Owner
Home Financials are based on the most recent Mortgage that was taken out on this home.
Original Mortgage
$147,184
Outstanding Balance
$127,473
Interest Rate
4.75%
Mortgage Type
FHA
Estimated Equity
$128,646
Purchase Details
Closed on
May 16, 2005
Sold by
Webster Terry Joe and Webster Robin D
Bought by
Lay Edwin C and Lay Nancy
Purchase Details
Closed on
May 6, 2005
Sold by
Webster Diane Marie
Bought by
Webster Terry Joe
Create a Home Valuation Report for This Property
The Home Valuation Report is an in-depth analysis detailing your home's value as well as a comparison with similar homes in the area
Home Values in the Area
Average Home Value in this Area
Purchase History
| Date | Buyer | Sale Price | Title Company |
|---|---|---|---|
| Rodriguez David | $150,000 | Titan Title & Closing | |
| Lay Edwin C | $129,000 | None Available | |
| Webster Terry Joe | -- | None Available |
Source: Public Records
Mortgage History
| Date | Status | Borrower | Loan Amount |
|---|---|---|---|
| Open | Rodriguez David | $147,184 |
Source: Public Records
Tax History Compared to Growth
Tax History
| Year | Tax Paid | Tax Assessment Tax Assessment Total Assessment is a certain percentage of the fair market value that is determined by local assessors to be the total taxable value of land and additions on the property. | Land | Improvement |
|---|---|---|---|---|
| 2025 | $2,491 | $20,924 | $3,060 | $17,864 |
| 2024 | $2,423 | $19,927 | $3,060 | $16,867 |
| 2023 | $2,423 | $18,978 | $3,060 | $15,918 |
| 2022 | $2,076 | $18,074 | $3,060 | $15,014 |
| 2021 | $2,042 | $17,214 | $3,060 | $14,154 |
| 2020 | $2,098 | $17,782 | $3,060 | $14,722 |
| 2019 | $2,137 | $18,028 | $3,060 | $14,968 |
| 2018 | $1,861 | $16,378 | $3,060 | $13,318 |
| 2017 | $1,851 | $16,378 | $3,060 | $13,318 |
| 2016 | $1,760 | $16,378 | $3,060 | $13,318 |
| 2015 | -- | $16,378 | $3,060 | $13,318 |
| 2014 | -- | $16,378 | $3,060 | $13,318 |
Source: Public Records
Map
Nearby Homes
- 819 Ridge Rd
- 1805 Glendale Rd
- 1608 Glendale Rd
- 1014 Ridge Rd
- 0 E Taft St
- 1241 Circle Dr
- 1440 Mabelle Dr
- 1348 E Mckinley Ave
- 1109 S Division St
- 0 Division St Unit 2535888
- 6 Mayfield St
- 813 E Teresa Ave
- 319 S Division St
- 1033 E Thompson Ave
- 1010 E Thompson Ave
- 1023 E Thompson Ave
- 2810 E Hwy 117
- 103 Woodview Ln
- 1140 E Hobson Ave
- 0 Line St Unit 2546638