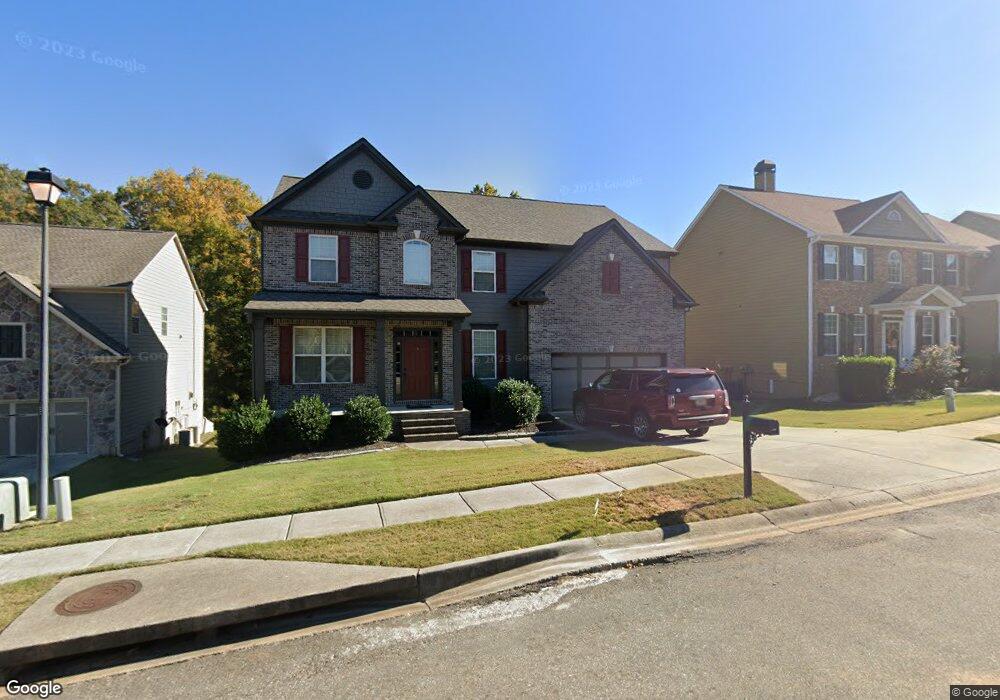
1707 Ammons Fall Ct Braselton, GA 30517
Estimated Value: $509,000 - $536,000
--
Bed
4
Baths
3,548
Sq Ft
$148/Sq Ft
Est. Value
About This Home
This home is located at 1707 Ammons Fall Ct, Braselton, GA 30517 and is currently estimated at $524,063, approximately $147 per square foot. 1707 Ammons Fall Ct is a home located in Barrow County with nearby schools including Bramlett Elementary School, Russell Middle School, and Winder-Barrow High School.
Ownership History
Date
Name
Owned For
Owner Type
Purchase Details
Closed on
Mar 19, 2021
Sold by
Hartley William M
Bought by
Koerner Nathan A and Koerner Ellen P
Current Estimated Value
Home Financials for this Owner
Home Financials are based on the most recent Mortgage that was taken out on this home.
Original Mortgage
$403,004
Outstanding Balance
$361,874
Interest Rate
2.8%
Mortgage Type
VA
Estimated Equity
$162,189
Purchase Details
Closed on
Apr 30, 2008
Sold by
Winmark Hms Inc
Bought by
Hartley William M and Hartley Shannon M
Home Financials for this Owner
Home Financials are based on the most recent Mortgage that was taken out on this home.
Original Mortgage
$280,156
Interest Rate
5.82%
Mortgage Type
New Conventional
Purchase Details
Closed on
Jul 19, 2007
Sold by
The Falls Llc
Bought by
Winmark Homes Inc
Purchase Details
Closed on
Apr 22, 2005
Bought by
The Falls Llc
Create a Home Valuation Report for This Property
The Home Valuation Report is an in-depth analysis detailing your home's value as well as a comparison with similar homes in the area
Home Values in the Area
Average Home Value in this Area
Purchase History
| Date | Buyer | Sale Price | Title Company |
|---|---|---|---|
| Koerner Nathan A | $389,000 | -- | |
| Hartley William M | $296,100 | -- | |
| Winmark Homes Inc | $62,000 | -- | |
| The Falls Llc | -- | -- |
Source: Public Records
Mortgage History
| Date | Status | Borrower | Loan Amount |
|---|---|---|---|
| Open | Koerner Nathan A | $403,004 | |
| Previous Owner | Hartley William M | $280,156 |
Source: Public Records
Tax History Compared to Growth
Tax History
| Year | Tax Paid | Tax Assessment Tax Assessment Total Assessment is a certain percentage of the fair market value that is determined by local assessors to be the total taxable value of land and additions on the property. | Land | Improvement |
|---|---|---|---|---|
| 2024 | $4,904 | $193,819 | $36,000 | $157,819 |
| 2023 | $4,978 | $193,819 | $36,000 | $157,819 |
| 2022 | $4,601 | $155,765 | $29,200 | $126,565 |
| 2021 | $4,195 | $132,454 | $24,000 | $108,454 |
| 2020 | $3,944 | $123,748 | $20,000 | $103,748 |
| 2019 | $3,851 | $119,041 | $20,000 | $99,041 |
| 2018 | $3,628 | $112,452 | $20,000 | $92,452 |
| 2017 | $2,909 | $99,909 | $20,000 | $79,909 |
| 2016 | $3,041 | $94,079 | $20,000 | $74,079 |
| 2015 | $3,070 | $94,874 | $20,000 | $74,874 |
| 2014 | $2,555 | $81,499 | $9,604 | $71,895 |
| 2013 | -- | $75,389 | $9,604 | $65,785 |
Source: Public Records
Map
Nearby Homes
- 1602 Sahale Falls Dr
- 2545 Olney Falls Dr
- 6356 Mossy Oak Landing
- 2560 Olney Falls Dr
- 7062 Grand Hickory Dr
- 1208 Loowit Falls Ct
- 2655 Old Winder Hwy
- 2651 Bald Cypress Dr
- 6834 White Walnut Way
- 6905 White Walnut Way
- 6895 White Walnut Way
- 2721 Bald Cypress Dr
- 9036 Lexington Ct
- 6125 Mulberry Park Dr
- 9628 Rushmore Cir
- 747 Sienna Valley Dr
- 2445 Retreat Point Pkwy
- 1707 Ammons Falls Ct
- 1707 Ammon Falls Ct
- 1709 Ammons Falls Ct
- 1705 Ammon Falls Ct
- 1709 Ammon Falls Ct
- 1703 Ammon Falls Ct
- 1708 Ammons Falls Ct Unit 1708
- 1708 Ammons Falls Ct
- 0 Ammons Falls Ct Unit 8606190
- 1711 Ammon Falls Ct
- 1706 Ammon Falls Ct
- 1708 Ammon Falls Ct
- 1704 Ammons Falls Ct
- 1704 Ammon Falls Ct
- 1704 Ammon Falls Ct Unit 108
- 0 Ammon Falls Unit 8946970
- 1701 Ammon Falls Ct
- 1710 Ammon Falls Ct
- 1702 Ammon Falls Ct Unit 107
- 1702 Ammon Falls Ct