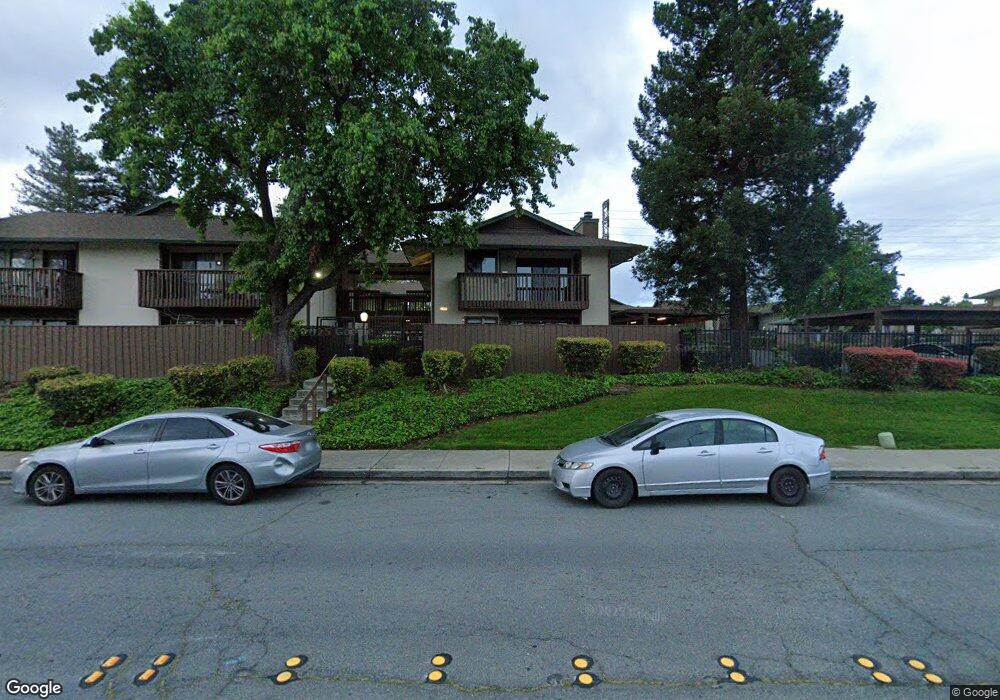
1707 Mahogany Way Unit 55 Antioch, CA 94509
North Antioch NeighborhoodEstimated Value: $223,009 - $276,000
2
Beds
1
Bath
845
Sq Ft
$290/Sq Ft
Est. Value
About This Home
This home is located at 1707 Mahogany Way Unit 55, Antioch, CA 94509 and is currently estimated at $244,752, approximately $289 per square foot. 1707 Mahogany Way Unit 55 is a home located in Contra Costa County with nearby schools including Marsh Elementary School, Park Middle School, and Antioch High School.
Ownership History
Date
Name
Owned For
Owner Type
Purchase Details
Closed on
Jul 20, 2000
Sold by
Liddington Mark T
Bought by
Lorentzen Linda L
Current Estimated Value
Home Financials for this Owner
Home Financials are based on the most recent Mortgage that was taken out on this home.
Original Mortgage
$88,250
Outstanding Balance
$31,512
Interest Rate
8.2%
Mortgage Type
FHA
Estimated Equity
$213,240
Purchase Details
Closed on
Mar 6, 1997
Sold by
Liddington Robert F and Liddington Katherine B
Bought by
Liddington Mark T
Purchase Details
Closed on
Nov 5, 1993
Sold by
Liddington Mark T and Liddington Alberta Faye
Bought by
Liddington Mark T and Liddington Robert F
Home Financials for this Owner
Home Financials are based on the most recent Mortgage that was taken out on this home.
Original Mortgage
$74,500
Interest Rate
6.91%
Mortgage Type
FHA
Create a Home Valuation Report for This Property
The Home Valuation Report is an in-depth analysis detailing your home's value as well as a comparison with similar homes in the area
Home Values in the Area
Average Home Value in this Area
Purchase History
| Date | Buyer | Sale Price | Title Company |
|---|---|---|---|
| Lorentzen Linda L | $91,000 | Old Republic Title Company | |
| Liddington Mark T | -- | -- | |
| Liddington Mark T | -- | Placer Title Co |
Source: Public Records
Mortgage History
| Date | Status | Borrower | Loan Amount |
|---|---|---|---|
| Open | Lorentzen Linda L | $88,250 | |
| Previous Owner | Liddington Mark T | $74,500 | |
| Closed | Lorentzen Linda L | $2,700 |
Source: Public Records
Tax History Compared to Growth
Tax History
| Year | Tax Paid | Tax Assessment Tax Assessment Total Assessment is a certain percentage of the fair market value that is determined by local assessors to be the total taxable value of land and additions on the property. | Land | Improvement |
|---|---|---|---|---|
| 2025 | $1,953 | $137,098 | $24,398 | $112,700 |
| 2024 | $1,894 | $134,411 | $23,920 | $110,491 |
| 2023 | $1,894 | $131,776 | $23,451 | $108,325 |
| 2022 | $1,868 | $129,193 | $22,992 | $106,201 |
| 2021 | $1,794 | $126,661 | $22,542 | $104,119 |
| 2019 | $1,748 | $122,906 | $21,874 | $101,032 |
| 2018 | $1,685 | $120,497 | $21,446 | $99,051 |
| 2017 | $1,634 | $118,135 | $21,026 | $97,109 |
| 2016 | $1,278 | $88,500 | $15,752 | $72,748 |
| 2015 | $999 | $64,500 | $11,480 | $53,020 |
| 2014 | $947 | $62,000 | $11,036 | $50,964 |
Source: Public Records
Map
Nearby Homes
- 1707 Mahogany Way Unit 63
- 1701 Mahogany Way Unit 38
- 1701 Mahogany Way Unit 47
- 2416 Shadow Ln Unit 74
- 2410 Shadow Ln Unit 92
- 1718 Springwood Way
- 2400 Horizon Ln Unit 136
- 1810 San Jose Dr
- 2415 Starlight Ln Unit 155
- 1904 San Jose Dr
- 2608 Rutgers Ln
- 1228 Buchanan Rd
- 2504 Bishop Ln
- 2404 Lemontree Ct Unit 1
- 2301 Lemontree Way Unit 1
- 2304 Peppertree Way Unit 4
- 2104 Lemontree Way Unit 1
- 2113 Lemontree Way Unit 3
- 2118 Peppertree Way Unit 4
- 2401 Peppertree Ct Unit 4
- 1707 Mahogany Way
- 1707 Mahogany Way Unit 37
- 1707 Mahogany Way Unit 62
- 1707 Mahogany Way Unit 61
- 1707 Mahogany Way Unit 60
- 1707 Mahogany Way Unit 59
- 1707 Mahogany Way Unit 58
- 1707 Mahogany Way Unit 57
- 1707 Mahogany Way Unit 56
- 1707 Mahogany Way Unit 54
- 1707 Mahogany Way Unit 53
- 1707 Mahogany Way Unit 52
- 1707 Mahogany Way Unit 51
- 1707 Mahogany Way Unit 50
- 1707 Mahogany Way Unit 48
- 1701 Mahogany Way #43
- 1701 Mahogany Way
- 1701 Mahogany Way
- 1701 Mahogany Way Unit 44
- 1701 Mahogany Way Unit 43