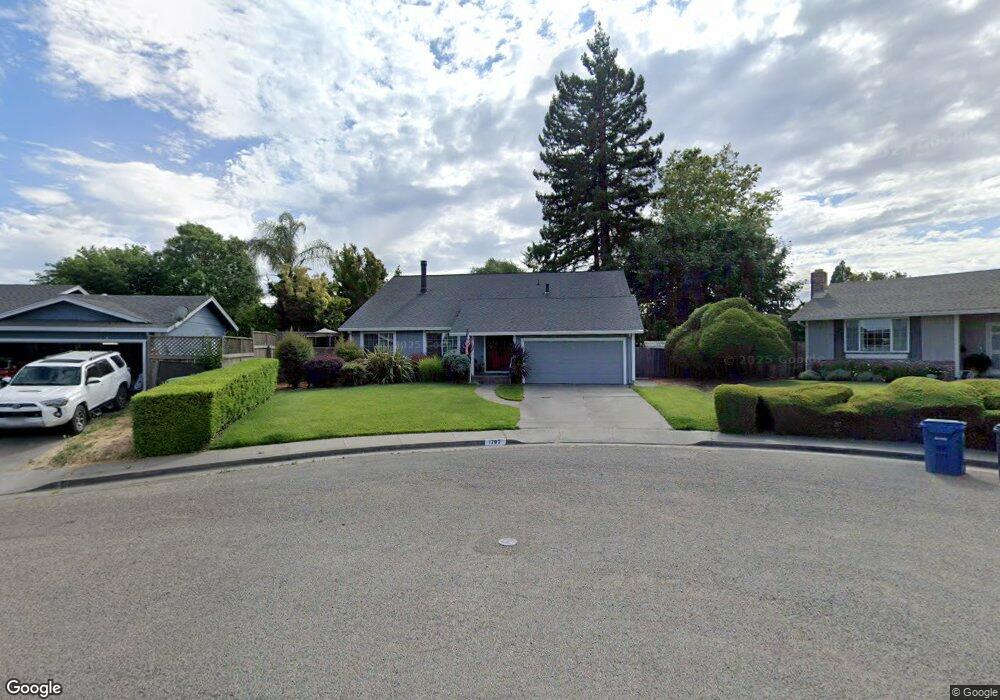
1707 Pauline Way Petaluma, CA 94954
Adobe NeighborhoodEstimated Value: $869,000 - $1,010,000
4
Beds
3
Baths
2,159
Sq Ft
$434/Sq Ft
Est. Value
About This Home
This home is located at 1707 Pauline Way, Petaluma, CA 94954 and is currently estimated at $937,157, approximately $434 per square foot. 1707 Pauline Way is a home located in Sonoma County with nearby schools including La Tercera Elementary School, Kenilworth Junior High School, and Casa Grande High School.
Ownership History
Date
Name
Owned For
Owner Type
Purchase Details
Closed on
Feb 23, 2015
Sold by
Johnson William Thomas and Johnson Sally Kuhrt
Bought by
Johnson William Thomas and Johnson Sally Kuhrt
Current Estimated Value
Home Financials for this Owner
Home Financials are based on the most recent Mortgage that was taken out on this home.
Original Mortgage
$200,000
Interest Rate
3.57%
Mortgage Type
New Conventional
Purchase Details
Closed on
Mar 27, 2000
Sold by
Kuhrt Johnson William Thomas and Kuhrt Sally
Bought by
Johnson William Thomas and Johnson Sally Kuhrt
Home Financials for this Owner
Home Financials are based on the most recent Mortgage that was taken out on this home.
Original Mortgage
$150,000
Interest Rate
8.38%
Mortgage Type
Credit Line Revolving
Purchase Details
Closed on
Jan 19, 1995
Sold by
Johnson William T and Johnson Sally K
Bought by
Joh William Thomas Johnson and Joh Sally Kuhrt
Create a Home Valuation Report for This Property
The Home Valuation Report is an in-depth analysis detailing your home's value as well as a comparison with similar homes in the area
Home Values in the Area
Average Home Value in this Area
Purchase History
| Date | Buyer | Sale Price | Title Company |
|---|---|---|---|
| Johnson William Thomas | -- | None Available | |
| Johnson William Thomas | -- | None Available | |
| Johnson William Thomas | -- | Chicago Title Co | |
| Joh William Thomas Johnson | -- | -- |
Source: Public Records
Mortgage History
| Date | Status | Borrower | Loan Amount |
|---|---|---|---|
| Closed | Johnson William Thomas | $200,000 | |
| Closed | Johnson William Thomas | $150,000 |
Source: Public Records
Tax History Compared to Growth
Tax History
| Year | Tax Paid | Tax Assessment Tax Assessment Total Assessment is a certain percentage of the fair market value that is determined by local assessors to be the total taxable value of land and additions on the property. | Land | Improvement |
|---|---|---|---|---|
| 2025 | $1,122 | $103,905 | $17,146 | $86,759 |
| 2024 | $1,122 | $101,868 | $16,810 | $85,058 |
| 2023 | $1,122 | $99,872 | $16,481 | $83,391 |
| 2022 | $1,095 | $97,914 | $16,158 | $81,756 |
| 2021 | $1,081 | $95,995 | $15,842 | $80,153 |
| 2020 | $1,088 | $95,012 | $15,680 | $79,332 |
| 2019 | $1,076 | $93,150 | $15,373 | $77,777 |
| 2018 | $1,045 | $91,324 | $15,072 | $76,252 |
| 2017 | $1,029 | $89,534 | $14,777 | $74,757 |
| 2016 | $988 | $87,780 | $14,488 | $73,292 |
| 2015 | $962 | $86,463 | $14,271 | $72,192 |
| 2014 | $952 | $84,770 | $13,992 | $70,778 |
Source: Public Records
Map
Nearby Homes
- 642 Albert Way
- 1711 Capistrano Dr
- 827 Grouse Ln
- 724 Garfield Dr
- 73 Alta Dr
- 601 Marylyn Cir Unit 21
- 602 Marylyn Cir
- 29 Palomino Ct
- 1688 Kearny Ct
- 2044 Willow Dr
- 1103 Marylyn Cir
- 2013 Knight Ave
- 29 Alta Dr
- 1785 Pine Ave
- 1627 Juliet Dr
- 1513 Elizabeth Dr
- 859 S Mcdowell Blvd
- 1705 Clairmont Ct
- 601 Reynolds Dr
- 2189 Saint Augustine Cir
- 1711 Pauline Way
- 1703 Pauline Way
- 621 Armida Dr
- 1708 Annetta Dr
- 1704 Annetta Dr
- 1712 Annetta Dr
- 1700 Annetta Dr
- 1653 Sarkesian Dr
- 1657 Sarkesian Dr
- 1716 Pauline Way
- 1649 Sarkesian Dr
- 1716 Annetta Dr
- 1719 Pauline Way
- 1701 Sarkesian Dr
- 1720 Annetta Dr
- 1720 Pauline Way
- 1642 Annetta Dr
- 620 Armida Dr
- 616 Armida Dr
- 1723 Pauline Way