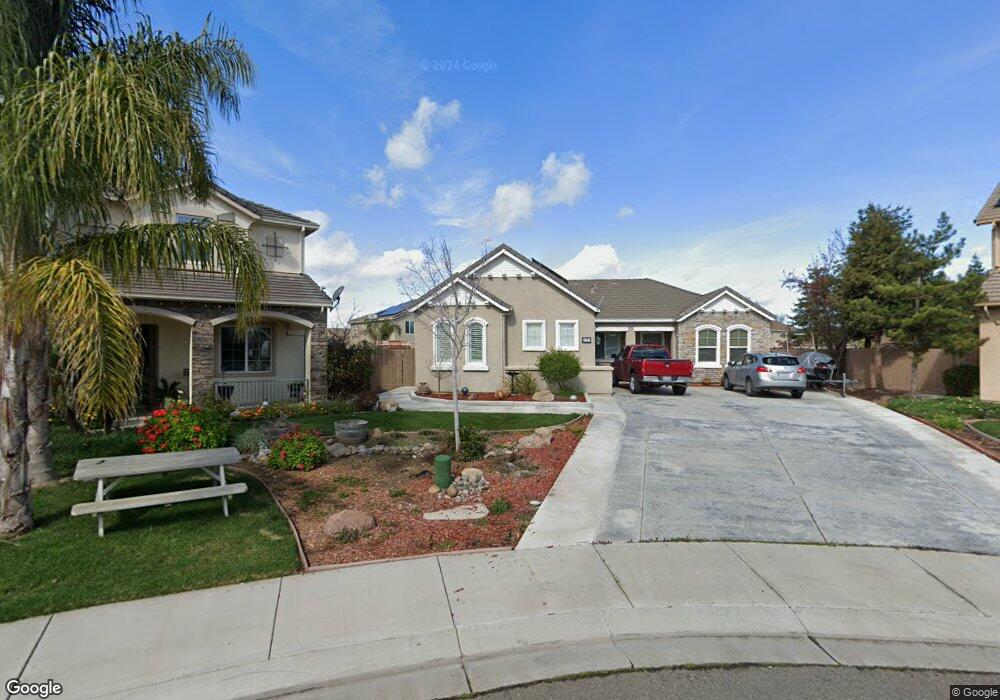
1707 Peat Ct Los Banos, CA 93635
Estimated Value: $562,000 - $615,000
3
Beds
2
Baths
2,191
Sq Ft
$269/Sq Ft
Est. Value
About This Home
This home is located at 1707 Peat Ct, Los Banos, CA 93635 and is currently estimated at $588,629, approximately $268 per square foot. 1707 Peat Ct is a home located in Merced County with nearby schools including Henry Miller Elementary School, Westside Union Elementary School, and Creekside Junior High School.
Ownership History
Date
Name
Owned For
Owner Type
Purchase Details
Closed on
Dec 15, 2014
Sold by
Belterra Properties Llc
Bought by
Cherroni Alex L and Cherroni Ruth M
Current Estimated Value
Home Financials for this Owner
Home Financials are based on the most recent Mortgage that was taken out on this home.
Original Mortgage
$305,915
Outstanding Balance
$234,674
Interest Rate
3.96%
Mortgage Type
New Conventional
Estimated Equity
$353,955
Purchase Details
Closed on
Jul 12, 2012
Sold by
Anderson Michael C and Anderson Ashleigh I
Bought by
Belterra Properties Llc
Purchase Details
Closed on
Nov 22, 2011
Sold by
Anderson Homes Inc
Bought by
Anderson Michael C and Anderson Ashleigh I
Home Financials for this Owner
Home Financials are based on the most recent Mortgage that was taken out on this home.
Original Mortgage
$123,958
Interest Rate
3.91%
Mortgage Type
Purchase Money Mortgage
Create a Home Valuation Report for This Property
The Home Valuation Report is an in-depth analysis detailing your home's value as well as a comparison with similar homes in the area
Home Values in the Area
Average Home Value in this Area
Purchase History
| Date | Buyer | Sale Price | Title Company |
|---|---|---|---|
| Cherroni Alex L | $360,000 | First American Title Company | |
| Belterra Properties Llc | -- | None Available | |
| Anderson Michael C | -- | First American Title Company |
Source: Public Records
Mortgage History
| Date | Status | Borrower | Loan Amount |
|---|---|---|---|
| Open | Cherroni Alex L | $305,915 | |
| Previous Owner | Anderson Michael C | $123,958 |
Source: Public Records
Tax History Compared to Growth
Tax History
| Year | Tax Paid | Tax Assessment Tax Assessment Total Assessment is a certain percentage of the fair market value that is determined by local assessors to be the total taxable value of land and additions on the property. | Land | Improvement |
|---|---|---|---|---|
| 2025 | $6,189 | $432,536 | $48,070 | $384,466 |
| 2024 | $6,189 | $424,056 | $47,128 | $376,928 |
| 2023 | $5,867 | $415,742 | $46,204 | $369,538 |
| 2022 | $5,744 | $407,592 | $45,299 | $362,293 |
| 2021 | $5,638 | $399,601 | $44,411 | $355,190 |
| 2020 | $5,566 | $395,504 | $43,956 | $351,548 |
| 2019 | $5,452 | $387,750 | $43,095 | $344,655 |
| 2018 | $5,292 | $380,148 | $42,250 | $337,898 |
| 2017 | $5,222 | $372,695 | $41,422 | $331,273 |
| 2016 | $5,247 | $365,388 | $40,610 | $324,778 |
| 2015 | $5,144 | $359,900 | $40,000 | $319,900 |
| 2014 | $2,716 | $143,448 | $13,320 | $130,128 |
Source: Public Records
Map
Nearby Homes
- 1732 Cobblefield Ln
- 1149 Bellflower Way
- 1664 Dolomite Dr
- The Pacifica Plan at Westbrook
- The Big Sur Plan at Westbrook
- The Capitola Plan at Westbrook
- The Montara Plan at Westbrook
- The Avila Plan at Westbrook
- 1666 Oak St
- 1859 Felsite St
- 1619 Tumbleweed Way
- 1649 Maidencane Way
- Residence 2188 Plan at The Pointe at Stonecreek
- Residence 2438 Plan at The Pointe at Stonecreek
- Residence 2018 Plan at The Pointe at Stonecreek
- Residence 1818 Plan at The Pointe at Stonecreek
- 1674 Pajaro Dr
- 1125 Pearl Dr
- 1862 Dunite Dr
- 1656 Dolomite Dr
- 1713 Peat Ct
- 1701 Peat Ct
- 1704 Cobblefield Ln
- 1710 Cobblefield Ln
- 1719 Peat Ct
- 1716 Cobblefield Ln
- 1706 Peat Ct
- 1175 Bellflower Way
- 1712 Peat Ct
- 1171 Bellflower Way
- 1179 Bellflower Way
- 1169 Bellflower Way
- 1718 Peat Ct
- 1165 Bellflower Way
- 1183 Bellflower Way
- 1161 Bellflower Way
- 1165 Turquoise Dr
- 1187 Bellflower Way
- 1173 Turquoise Dr
- 1715 Cobblefield Ln