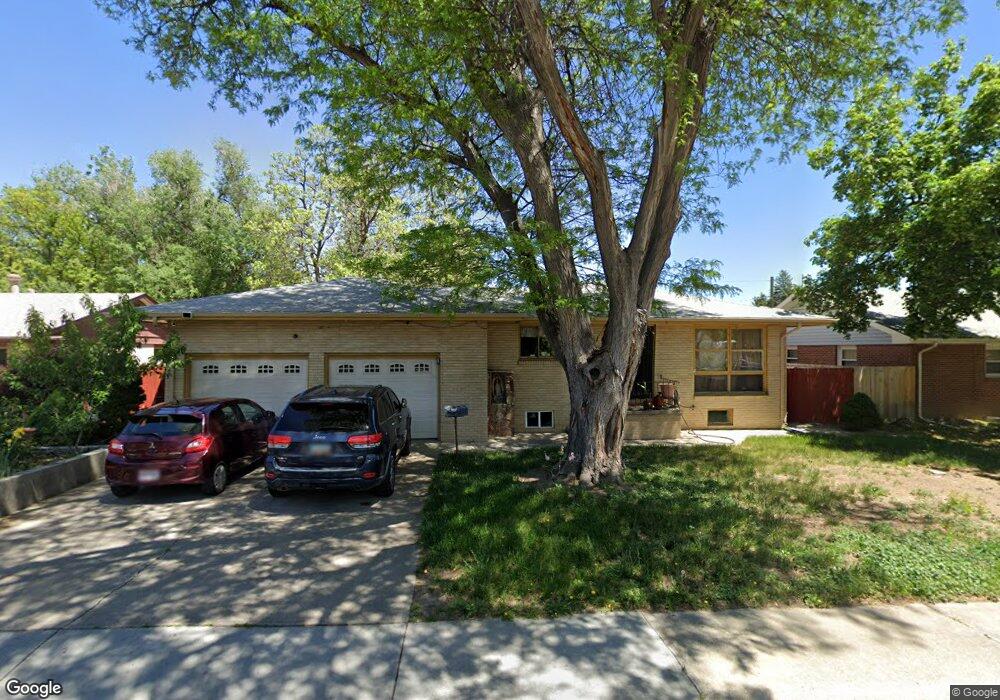
1708 Collyer St Longmont, CO 80501
Lanyon NeighborhoodEstimated Value: $418,000 - $466,000
3
Beds
2
Baths
1,044
Sq Ft
$428/Sq Ft
Est. Value
About This Home
This home is located at 1708 Collyer St, Longmont, CO 80501 and is currently estimated at $446,330, approximately $427 per square foot. 1708 Collyer St is a home located in Boulder County with nearby schools including Timberline Pk-8, Skyline High School, and Longmont Christian School.
Ownership History
Date
Name
Owned For
Owner Type
Purchase Details
Closed on
May 3, 2018
Sold by
Medina Jesus Rea
Bought by
Median Graciela A
Current Estimated Value
Home Financials for this Owner
Home Financials are based on the most recent Mortgage that was taken out on this home.
Original Mortgage
$110,000
Outstanding Balance
$94,714
Interest Rate
4.4%
Mortgage Type
New Conventional
Estimated Equity
$351,616
Purchase Details
Closed on
Jun 26, 1998
Sold by
Peever Robert L
Bought by
Medina Graciela A
Home Financials for this Owner
Home Financials are based on the most recent Mortgage that was taken out on this home.
Original Mortgage
$81,000
Interest Rate
7.08%
Purchase Details
Closed on
May 18, 1988
Bought by
Medina Graciela A and Medina Jesus Rea
Purchase Details
Closed on
Nov 2, 1987
Bought by
Medina Graciela A and Medina Jesus Rea
Purchase Details
Closed on
Apr 23, 1986
Bought by
Medina Graciela A and Medina Jesus Rea
Create a Home Valuation Report for This Property
The Home Valuation Report is an in-depth analysis detailing your home's value as well as a comparison with similar homes in the area
Home Values in the Area
Average Home Value in this Area
Purchase History
| Date | Buyer | Sale Price | Title Company |
|---|---|---|---|
| Median Graciela A | $80,000 | None Available | |
| Medina Graciela A | $125,000 | First American Heritage Titl | |
| Medina Graciela A | -- | -- | |
| Medina Graciela A | -- | -- | |
| Medina Graciela A | $77,600 | -- |
Source: Public Records
Mortgage History
| Date | Status | Borrower | Loan Amount |
|---|---|---|---|
| Open | Median Graciela A | $110,000 | |
| Previous Owner | Medina Graciela A | $81,000 |
Source: Public Records
Tax History Compared to Growth
Tax History
| Year | Tax Paid | Tax Assessment Tax Assessment Total Assessment is a certain percentage of the fair market value that is determined by local assessors to be the total taxable value of land and additions on the property. | Land | Improvement |
|---|---|---|---|---|
| 2025 | $2,178 | $24,838 | $7,888 | $16,950 |
| 2024 | $2,178 | $24,838 | $7,888 | $16,950 |
| 2023 | $2,149 | $22,773 | $8,757 | $17,701 |
| 2022 | $1,938 | $19,586 | $6,603 | $12,983 |
| 2021 | $1,963 | $20,149 | $6,793 | $13,356 |
| 2020 | $1,786 | $18,390 | $6,292 | $12,098 |
| 2019 | $1,758 | $18,390 | $6,292 | $12,098 |
| 2018 | $1,474 | $15,516 | $6,336 | $9,180 |
| 2017 | $1,454 | $17,154 | $7,005 | $10,149 |
| 2016 | $1,335 | $13,970 | $5,413 | $8,557 |
| 2015 | $1,272 | $11,853 | $3,662 | $8,191 |
| 2014 | $1,107 | $11,853 | $3,662 | $8,191 |
Source: Public Records
Map
Nearby Homes
- 303 17th Ave
- 1818 Atwood St
- 1833 Atwood St
- 117 Valentine Ln
- 16 Merideth Ln
- 1514 Collyer St
- 1943 Meadow Dr Unit B2
- 1933 Emery St
- 1501 Liberty Ct
- 1711 Antero Dr
- 50 Forsyth Dr
- 50 19th Ave
- 22 Emery Way
- 729 17th Ave Unit 46
- 729 17th Ave Unit 16
- 1830 Red Cloud Rd
- 1530 Terry St
- 1840 Red Cloud Rd
- 821 17th Ave Unit 9
- 2014 Red Cloud Rd
- 1716 Collyer St
- 1702 Collyer St
- 1709 Atwood St
- 1703 Atwood St
- 1724 Collyer St
- 1715 Atwood St
- 1711 Collyer St
- 1705 Collyer St
- 1719 Collyer St
- 1721 Atwood St
- 1730 Collyer St
- 1723 Collyer St
- 217 17th Ave
- 217 17th Ave
- 303 17th Ave
- 1727 Atwood St
- 1708 Corey St
- 1708 Atwood St
- 1733 Collyer St
- 1714 Corey St