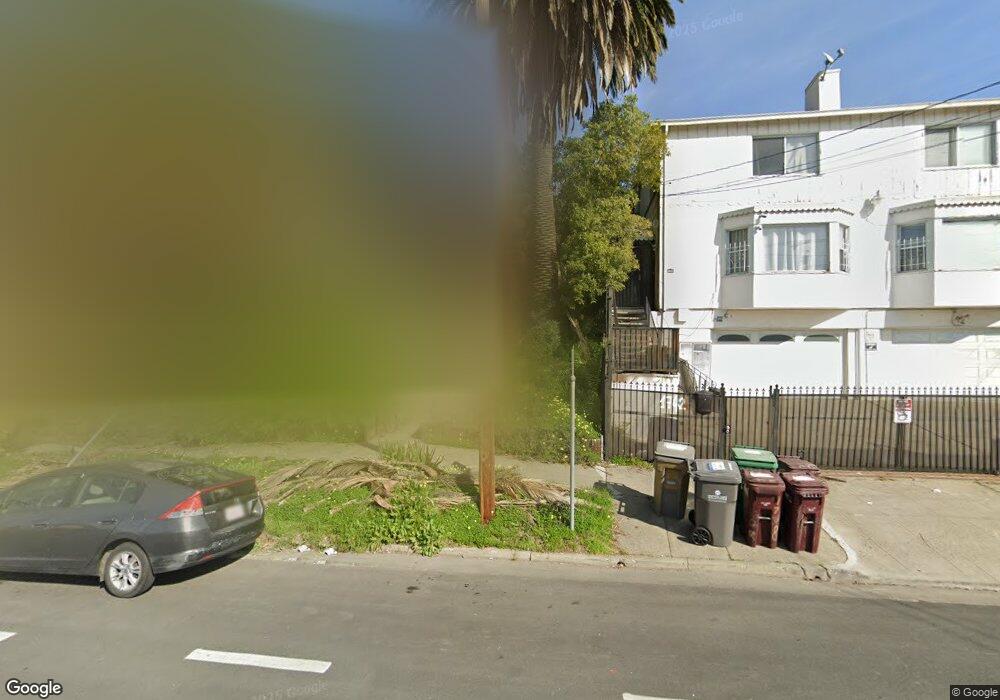
1708 E 21st St Oakland, CA 94606
Highland Terrace NeighborhoodEstimated Value: $531,000 - $602,000
1
Bed
2
Baths
1,073
Sq Ft
$537/Sq Ft
Est. Value
About This Home
This home is located at 1708 E 21st St, Oakland, CA 94606 and is currently estimated at $575,808, approximately $536 per square foot. 1708 E 21st St is a home located in Alameda County with nearby schools including Garfield Elementary School, Roosevelt Middle School, and Oakland High School.
Ownership History
Date
Name
Owned For
Owner Type
Purchase Details
Closed on
Nov 14, 2013
Sold by
Carr Jeffrey D and Carr Patricia J
Bought by
Burdge Hilary
Current Estimated Value
Home Financials for this Owner
Home Financials are based on the most recent Mortgage that was taken out on this home.
Original Mortgage
$280,000
Outstanding Balance
$208,312
Interest Rate
4.17%
Mortgage Type
New Conventional
Estimated Equity
$367,496
Purchase Details
Closed on
Oct 9, 2013
Sold by
Carr Jeffrey D and Carr Patricia J
Bought by
Carr Jeffrey D and Carr Patricia J
Home Financials for this Owner
Home Financials are based on the most recent Mortgage that was taken out on this home.
Original Mortgage
$280,000
Outstanding Balance
$208,312
Interest Rate
4.17%
Mortgage Type
New Conventional
Estimated Equity
$367,496
Purchase Details
Closed on
Nov 15, 2001
Sold by
Carr Jeffrey D and Carr Patricia J
Bought by
Carr Jeffrey D and Carr Patricia D
Create a Home Valuation Report for This Property
The Home Valuation Report is an in-depth analysis detailing your home's value as well as a comparison with similar homes in the area
Home Values in the Area
Average Home Value in this Area
Purchase History
| Date | Buyer | Sale Price | Title Company |
|---|---|---|---|
| Burdge Hilary | $360,000 | Chicago Title Company | |
| Carr Jeffrey D | -- | None Available | |
| Carr Jeffrey D | -- | -- |
Source: Public Records
Mortgage History
| Date | Status | Borrower | Loan Amount |
|---|---|---|---|
| Open | Burdge Hilary | $280,000 |
Source: Public Records
Tax History
| Year | Tax Paid | Tax Assessment Tax Assessment Total Assessment is a certain percentage of the fair market value that is determined by local assessors to be the total taxable value of land and additions on the property. | Land | Improvement |
|---|---|---|---|---|
| 2025 | $7,301 | $441,291 | $132,387 | $308,904 |
| 2024 | $7,301 | $432,640 | $129,792 | $302,848 |
| 2023 | $7,618 | $424,158 | $127,247 | $296,911 |
| 2022 | $7,394 | $415,842 | $124,752 | $291,090 |
| 2021 | $7,018 | $407,691 | $122,307 | $285,384 |
| 2020 | $7,187 | $403,512 | $121,053 | $282,459 |
| 2019 | $6,648 | $395,603 | $118,681 | $276,922 |
| 2018 | $6,512 | $387,848 | $116,354 | $271,494 |
| 2017 | $6,252 | $380,245 | $114,073 | $266,172 |
| 2016 | $6,016 | $372,790 | $111,837 | $260,953 |
| 2015 | $6,151 | $367,191 | $110,157 | $257,034 |
| 2014 | $6,021 | $360,000 | $108,000 | $252,000 |
Source: Public Records
Map
Nearby Homes
Your Personal Tour Guide
Ask me questions while you tour the home.