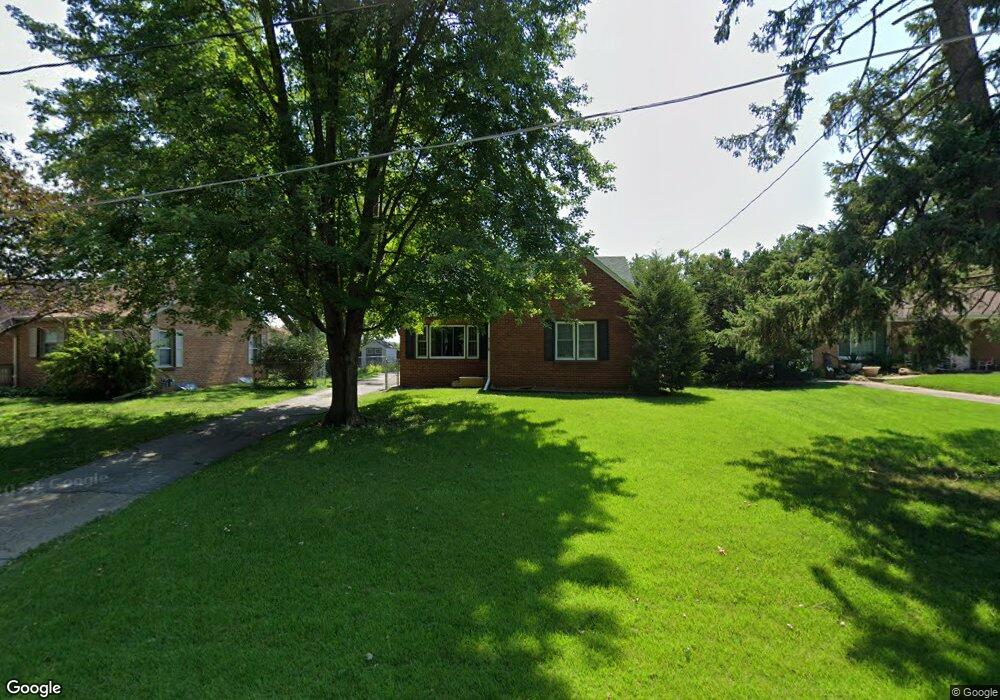
1708 Elm St West Des Moines, IA 50265
Estimated Value: $225,000 - $283,000
3
Beds
1
Bath
1,477
Sq Ft
$172/Sq Ft
Est. Value
About This Home
This home is located at 1708 Elm St, West Des Moines, IA 50265 and is currently estimated at $254,693, approximately $172 per square foot. 1708 Elm St is a home located in Polk County with nearby schools including Hillside Elementary School, Stilwell Junior High School, and Valley Southwoods Freshman High School.
Ownership History
Date
Name
Owned For
Owner Type
Purchase Details
Closed on
Apr 5, 2010
Sold by
Grimm Osborn L and Grimm Shannon D
Bought by
Talley Cory E
Current Estimated Value
Home Financials for this Owner
Home Financials are based on the most recent Mortgage that was taken out on this home.
Original Mortgage
$141,391
Outstanding Balance
$96,113
Interest Rate
5.5%
Mortgage Type
FHA
Estimated Equity
$158,580
Purchase Details
Closed on
Mar 9, 2007
Sold by
Wood Mark A and Wood Shelly S
Bought by
Grimm Osborn L and Grimm Shannon D
Home Financials for this Owner
Home Financials are based on the most recent Mortgage that was taken out on this home.
Original Mortgage
$139,650
Interest Rate
6.4%
Mortgage Type
Purchase Money Mortgage
Purchase Details
Closed on
May 14, 2001
Sold by
Cota James R and Waters Frances E
Bought by
Wood Mark A and Wood Shelly S
Home Financials for this Owner
Home Financials are based on the most recent Mortgage that was taken out on this home.
Original Mortgage
$96,800
Interest Rate
7.07%
Create a Home Valuation Report for This Property
The Home Valuation Report is an in-depth analysis detailing your home's value as well as a comparison with similar homes in the area
Home Values in the Area
Average Home Value in this Area
Purchase History
| Date | Buyer | Sale Price | Title Company |
|---|---|---|---|
| Talley Cory E | $143,500 | None Available | |
| Grimm Osborn L | $146,500 | None Available | |
| Wood Mark A | $107,500 | -- |
Source: Public Records
Mortgage History
| Date | Status | Borrower | Loan Amount |
|---|---|---|---|
| Open | Talley Cory E | $141,391 | |
| Previous Owner | Grimm Osborn L | $139,650 | |
| Previous Owner | Wood Mark A | $96,800 |
Source: Public Records
Tax History Compared to Growth
Tax History
| Year | Tax Paid | Tax Assessment Tax Assessment Total Assessment is a certain percentage of the fair market value that is determined by local assessors to be the total taxable value of land and additions on the property. | Land | Improvement |
|---|---|---|---|---|
| 2025 | $3,380 | $235,500 | $72,400 | $163,100 |
| 2024 | $3,380 | $213,300 | $64,500 | $148,800 |
| 2023 | $3,434 | $213,300 | $64,500 | $148,800 |
| 2022 | $3,392 | $177,800 | $55,900 | $121,900 |
| 2021 | $3,246 | $177,800 | $55,900 | $121,900 |
| 2020 | $3,198 | $161,900 | $50,800 | $111,100 |
| 2019 | $3,064 | $161,900 | $50,800 | $111,100 |
| 2018 | $3,072 | $149,600 | $45,900 | $103,700 |
| 2017 | $2,956 | $149,600 | $45,900 | $103,700 |
| 2016 | $2,890 | $139,800 | $42,400 | $97,400 |
| 2015 | $2,890 | $139,800 | $42,400 | $97,400 |
| 2014 | $2,712 | $133,700 | $39,700 | $94,000 |
Source: Public Records
Map
Nearby Homes
- 2002 Maple Cir
- 1725 Grand Ave
- 2006 Maple Cir
- 1916 Locust St
- 2021 Elm Cir
- 226 Holiday Cir Unit 43
- 2117 Walnut St
- 1829 Pearl Dr
- 536 14th St
- 212 25th St
- 616 14th St
- 124 25th Ct
- 1220 Vine St
- 2247 Grand Ave Unit 12
- 2247 Grand Ave Unit 2
- 2253 Grand Ave Unit 8
- 2816 Giles St
- 2509 Fairlawn Dr
- 800 13th St
- 205 S 29th St