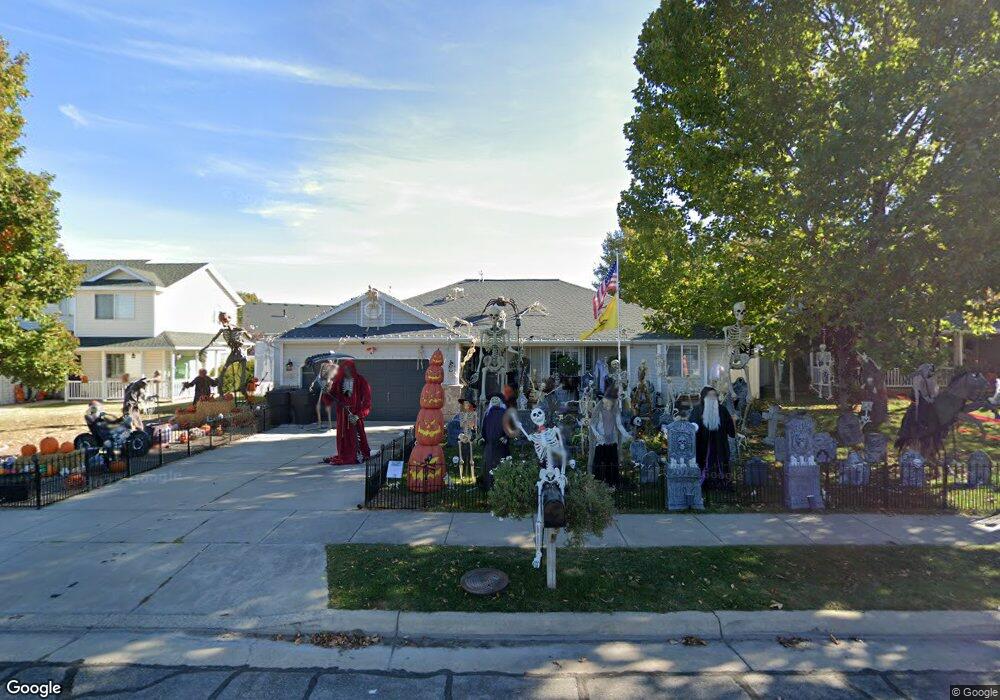
1708 N 2615 W Clearfield, UT 84015
Estimated Value: $439,511 - $484,000
3
Beds
2
Baths
1,646
Sq Ft
$281/Sq Ft
Est. Value
About This Home
This home is located at 1708 N 2615 W, Clearfield, UT 84015 and is currently estimated at $462,878, approximately $281 per square foot. 1708 N 2615 W is a home located in Davis County with nearby schools including West Clinton Elementary School, West Point Junior High School, and Syracuse High School.
Ownership History
Date
Name
Owned For
Owner Type
Purchase Details
Closed on
Jan 11, 2018
Sold by
Treehouse Investments Llc
Bought by
Bullock Amber C
Current Estimated Value
Home Financials for this Owner
Home Financials are based on the most recent Mortgage that was taken out on this home.
Original Mortgage
$243,000
Outstanding Balance
$204,532
Interest Rate
3.93%
Mortgage Type
New Conventional
Estimated Equity
$258,346
Purchase Details
Closed on
Oct 27, 2017
Sold by
Morgan Hallie
Bought by
Treejouse Investment Llc
Home Financials for this Owner
Home Financials are based on the most recent Mortgage that was taken out on this home.
Original Mortgage
$166,000
Interest Rate
3.78%
Mortgage Type
Purchase Money Mortgage
Purchase Details
Closed on
Aug 4, 2006
Sold by
Backus Hallie A and Morgan Hallie
Bought by
Morgan Hallie
Purchase Details
Closed on
May 3, 1996
Sold by
Palladian Home Inc
Bought by
Backus Hallie A
Create a Home Valuation Report for This Property
The Home Valuation Report is an in-depth analysis detailing your home's value as well as a comparison with similar homes in the area
Home Values in the Area
Average Home Value in this Area
Purchase History
| Date | Buyer | Sale Price | Title Company |
|---|---|---|---|
| Bullock Amber C | -- | Meridian Title | |
| Treejouse Investment Llc | -- | Meridian Title | |
| Morgan Hallie | -- | None Available | |
| Backus Hallie A | -- | Blacks Title Inc | |
| Palladian Homes Inc | -- | Blacks Title Inc | |
| Fox Farms Llc | -- | Blacks Title Inc | |
| Backus Hallie A | -- | Blacks Title Inc | |
| Palladian Homes Inc | -- | Blacks Title Inc | |
| Fox Farms Llc | -- | Blacks Title Inc |
Source: Public Records
Mortgage History
| Date | Status | Borrower | Loan Amount |
|---|---|---|---|
| Open | Bullock Amber C | $243,000 | |
| Previous Owner | Treejouse Investment Llc | $166,000 |
Source: Public Records
Tax History Compared to Growth
Tax History
| Year | Tax Paid | Tax Assessment Tax Assessment Total Assessment is a certain percentage of the fair market value that is determined by local assessors to be the total taxable value of land and additions on the property. | Land | Improvement |
|---|---|---|---|---|
| 2025 | $2,311 | $222,201 | $83,254 | $138,947 |
| 2024 | $2,231 | $215,600 | $92,218 | $123,382 |
| 2023 | $2,030 | $363,000 | $103,688 | $259,312 |
| 2022 | $2,168 | $214,500 | $64,945 | $149,555 |
| 2021 | $1,976 | $290,000 | $78,745 | $211,255 |
| 2020 | $1,714 | $249,000 | $65,591 | $183,409 |
| 2019 | $1,649 | $234,000 | $79,110 | $154,890 |
| 2018 | $1,521 | $212,000 | $67,146 | $144,854 |
| 2016 | $1,433 | $103,180 | $25,865 | $77,315 |
| 2015 | $1,316 | $90,090 | $25,865 | $64,225 |
| 2014 | $1,339 | $93,096 | $25,865 | $67,231 |
| 2013 | -- | $83,931 | $22,908 | $61,023 |
Source: Public Records
Map
Nearby Homes
- 1648 N 2615 W
- 1509 N 2475 W
- 1449 N 2475 W
- 2617 N 2080 W Unit 176
- 2647 W 1445 N
- 2259 W 1800 N
- 1458 N 2400 W
- 1694 N 2225 W
- 3941 W 1800 N
- Harvard Plan at Summerfield - Enclave
- 2208 W 2615 N
- Linden Plan at Summerfield - Vista
- Yale Plan at Summerfield - Enclave
- Gambel Oak Plan at Summerfield - Vista
- Cedar Plan at Summerfield - Vista
- Elm Plan at Summerfield - Vista
- Princeton Plan at Summerfield - Enclave
- Cambridge Plan at Summerfield - Enclave
- Cornell Plan at Summerfield - Enclave
- Sycamore Plan at Summerfield - Vista
- 1694 N 2615 W
- 1732 N 2615 W
- 2588 W 1725 N Unit 7
- 2588 W 1725 N
- 2574 W 1725 N Unit 6
- 1682 N 2615 W
- 1756 N 2615 W
- 1756 N 2615 W Unit 3
- 2567 W 1725 N Unit 8
- 2623 W 1700 N
- 1695 N 2615 W
- 2562 W 1725 N
- 1768 N 2615 W
- 2626 W 1700 N
- 1678 N 2615 W
- 1678 N 2615 W Unit 8
- 1689 N 2615 W
- 2582 W 1675 N
- 2559 W 1725 N Unit 12
- 2559 W 1725 N