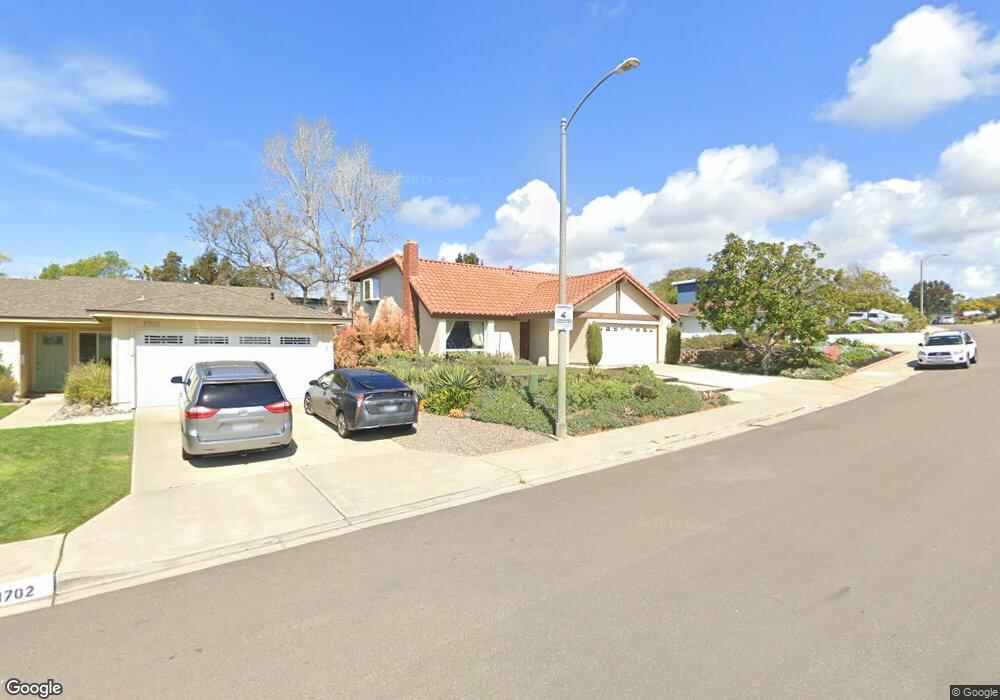
1708 Red Barn Rd Encinitas, CA 92024
Central Encinitas NeighborhoodEstimated Value: $1,528,000 - $1,741,000
4
Beds
2
Baths
1,831
Sq Ft
$892/Sq Ft
Est. Value
About This Home
This home is located at 1708 Red Barn Rd, Encinitas, CA 92024 and is currently estimated at $1,633,898, approximately $892 per square foot. 1708 Red Barn Rd is a home located in San Diego County with nearby schools including Park Dale Lane Elementary, Diegueno Middle School, and La Costa Canyon High School.
Ownership History
Date
Name
Owned For
Owner Type
Purchase Details
Closed on
Oct 21, 2016
Sold by
Costa Gordon R and Costa Robin G
Bought by
Costa Gordon R and Costa Robin G
Current Estimated Value
Home Financials for this Owner
Home Financials are based on the most recent Mortgage that was taken out on this home.
Original Mortgage
$175,000
Outstanding Balance
$140,473
Interest Rate
3.5%
Mortgage Type
New Conventional
Estimated Equity
$1,493,425
Purchase Details
Closed on
Oct 3, 1996
Sold by
Chris Beliveau
Bought by
Costa Gordon R and Costa Robin G
Home Financials for this Owner
Home Financials are based on the most recent Mortgage that was taken out on this home.
Original Mortgage
$182,500
Interest Rate
7.25%
Purchase Details
Closed on
Jul 11, 1984
Create a Home Valuation Report for This Property
The Home Valuation Report is an in-depth analysis detailing your home's value as well as a comparison with similar homes in the area
Home Values in the Area
Average Home Value in this Area
Purchase History
| Date | Buyer | Sale Price | Title Company |
|---|---|---|---|
| Costa Gordon R | -- | Title365 | |
| Costa Gordon R | $203,000 | South Coast Title Co | |
| -- | $128,000 | -- |
Source: Public Records
Mortgage History
| Date | Status | Borrower | Loan Amount |
|---|---|---|---|
| Open | Costa Gordon R | $175,000 | |
| Closed | Costa Gordon R | $182,500 |
Source: Public Records
Tax History
| Year | Tax Paid | Tax Assessment Tax Assessment Total Assessment is a certain percentage of the fair market value that is determined by local assessors to be the total taxable value of land and additions on the property. | Land | Improvement |
|---|---|---|---|---|
| 2025 | $4,021 | $330,600 | $162,856 | $167,744 |
| 2024 | $4,021 | $324,118 | $159,663 | $164,455 |
| 2023 | $3,880 | $317,764 | $156,533 | $161,231 |
| 2022 | $3,770 | $311,534 | $153,464 | $158,070 |
| 2021 | $3,688 | $305,426 | $150,455 | $154,971 |
| 2020 | $3,614 | $302,295 | $148,913 | $153,382 |
| 2019 | $3,545 | $296,369 | $145,994 | $150,375 |
| 2018 | $3,495 | $290,559 | $143,132 | $147,427 |
| 2017 | $191 | $284,863 | $140,326 | $144,537 |
| 2016 | $3,338 | $279,278 | $137,575 | $141,703 |
| 2015 | $3,265 | $275,084 | $135,509 | $139,575 |
| 2014 | $3,178 | $269,696 | $132,855 | $136,841 |
Source: Public Records
Map
Nearby Homes
- 1824 Eastwood Ln
- 1830 Gatepost Rd
- 1517 Shields Ave
- 1709 Edgefield Ln
- 1617 Blossom Field Way
- 1642 Blossom Field Way
- 114 Cerro St
- 1733 Gentle Breeze Ln
- 324 Countrywood Ln
- 1971 Azure Way
- 1986 Azure Way Unit 107
- 1741 Charleston Ln
- 1105 Catania Ct Unit 201
- 804 & 814 Clark Ave
- 3736 38 Via Rancho Michelle
- 200 202 Neptune Ave
- 772 Conestoga Ct
- 250 258 Hillcrest Dr
- 2037 Countrywood Way
- 1644 Forestdale Dr
- 1702 Red Barn Rd
- 1714 Red Barn Rd
- 1709 Deerfield Rd
- 1703 Deerfield Rd
- 1713 Deerfield Rd
- 1720 Red Barn Rd Unit 2
- 215 Village Run W
- 1709 Red Barn Rd
- 1715 Red Barn Rd
- 1719 Deerfield Rd
- 224 Village Run W
- 1726 Red Barn Rd
- 1721 Red Barn Rd
- 209 Village Run W
- 230 Village Run W
- 234 Village Run W
- 1725 Deerfield Rd
- 1727 Red Barn Rd
- 214 Village Green Rd
- 214 Village Run W
Your Personal Tour Guide
Ask me questions while you tour the home.