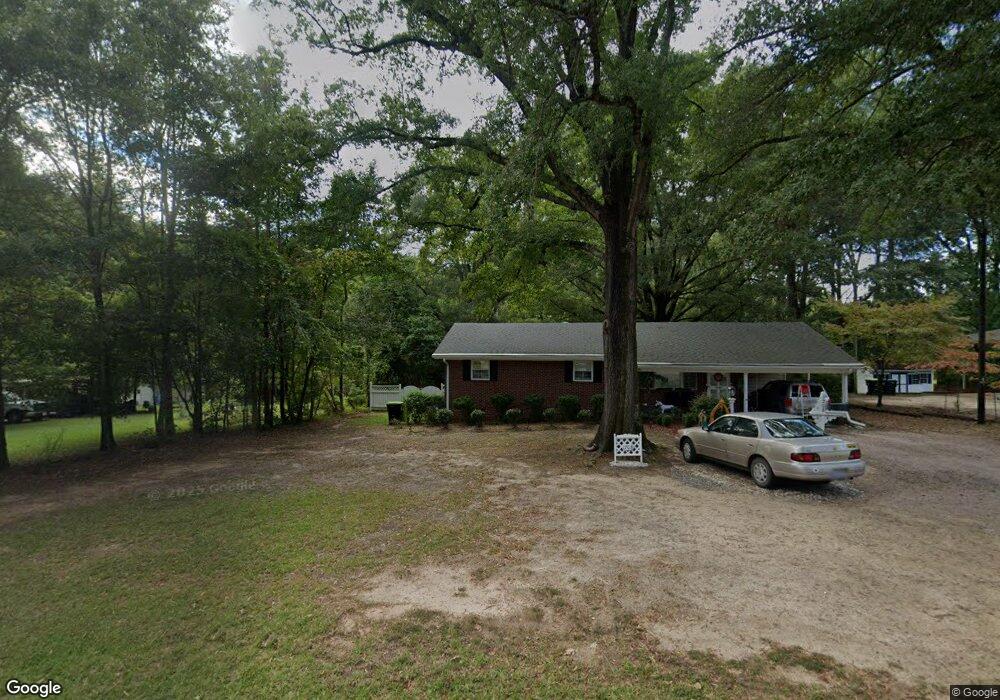
1708 S Mineral Springs Rd Durham, NC 27703
Eastern Durham NeighborhoodEstimated Value: $264,000 - $291,031
3
Beds
2
Baths
1,125
Sq Ft
$244/Sq Ft
Est. Value
About This Home
This home is located at 1708 S Mineral Springs Rd, Durham, NC 27703 and is currently estimated at $274,008, approximately $243 per square foot. 1708 S Mineral Springs Rd is a home located in Durham County with nearby schools including Bethesda Elementary School, John W Neal Middle School, and Southern School of Energy & Sustainability.
Ownership History
Date
Name
Owned For
Owner Type
Purchase Details
Closed on
May 2, 2024
Sold by
Carden Kimberly C and Carden Charlie
Bought by
Owosile Akim and Owosile Olubunmi B
Current Estimated Value
Home Financials for this Owner
Home Financials are based on the most recent Mortgage that was taken out on this home.
Original Mortgage
$266,750
Outstanding Balance
$262,945
Interest Rate
6.79%
Mortgage Type
New Conventional
Estimated Equity
$11,063
Purchase Details
Closed on
Apr 28, 2013
Sold by
Carlton James Wesley and Carlton Joan Turner
Bought by
Carlton James Wesley
Purchase Details
Closed on
Apr 24, 2013
Sold by
Carden Kim Carlton and Carden Dharlie Julius
Bought by
Carlton James Wesley and Carlton Joan Turner
Create a Home Valuation Report for This Property
The Home Valuation Report is an in-depth analysis detailing your home's value as well as a comparison with similar homes in the area
Home Values in the Area
Average Home Value in this Area
Purchase History
| Date | Buyer | Sale Price | Title Company |
|---|---|---|---|
| Owosile Akim | $275,000 | None Listed On Document | |
| Carlton James Wesley | -- | None Available | |
| Carlton James Wesley | -- | None Available |
Source: Public Records
Mortgage History
| Date | Status | Borrower | Loan Amount |
|---|---|---|---|
| Open | Owosile Akim | $266,750 |
Source: Public Records
Tax History Compared to Growth
Tax History
| Year | Tax Paid | Tax Assessment Tax Assessment Total Assessment is a certain percentage of the fair market value that is determined by local assessors to be the total taxable value of land and additions on the property. | Land | Improvement |
|---|---|---|---|---|
| 2025 | $1,581 | $284,458 | $103,600 | $180,858 |
| 2024 | $1,581 | $143,351 | $29,600 | $113,751 |
| 2023 | $1,520 | $143,351 | $29,600 | $113,751 |
| 2022 | $1,470 | $143,351 | $29,600 | $113,751 |
| 2021 | $1,257 | $143,351 | $29,600 | $113,751 |
| 2020 | $1,229 | $143,351 | $29,600 | $113,751 |
| 2019 | $1,214 | $143,351 | $29,600 | $113,751 |
| 2018 | $1,139 | $123,425 | $29,600 | $93,825 |
| 2017 | $1,102 | $123,425 | $29,600 | $93,825 |
| 2016 | $1,068 | $123,425 | $29,600 | $93,825 |
| 2015 | $1,025 | $95,992 | $27,222 | $68,770 |
| 2014 | $1,030 | $95,992 | $27,222 | $68,770 |
Source: Public Records
Map
Nearby Homes
- 533 Kings Lake Way
- 1821 S Mineral Springs Rd
- 200 Callandale Ln
- Winstead III Plan at Mica Ridge - Sterling Collection
- Nelson Plan at Mica Ridge - Sterling Collection
- Somerset III Plan at Mica Ridge - Sterling Collection
- 543 Callandale Ln
- 3465 Delmar Dr
- 3463 Delmar Dr
- 3459 Delmar Dr
- 3457 Delmar Dr
- 3461 Delmar Dr
- 1613 Waddell Ct
- 110 Elmsford St
- 1607 Willowcrest Rd
- 111 Glenview Ln
- 104 Elmsford St
- 1030 Thoughtful Spot Ln
- 2036 October Dr
- 1525 S Mineral Springs Rd
- 1704 S Mineral Springs Rd
- 1716 S Mineral Springs Rd
- 1616 S Mineral Springs Rd
- 32 Oxmoor Dr
- 36 Oxmoor Dr
- 28 Oxmoor Dr
- 24 Oxmoor Dr
- 1806 S Mineral Springs Rd
- 40 Oxmoor Dr
- 20 Oxmoor Dr
- 350 Windrush Ln
- 31 Oxmoor Dr
- 16 Oxmoor Dr
- 344 Windrush Ln
- 44 Oxmoor Dr
- 21 Oxmoor Dr
- 35 Oxmoor Dr
- 340 Windrush Ln
- 12 Oxmoor Dr
- 39 Oxmoor Dr