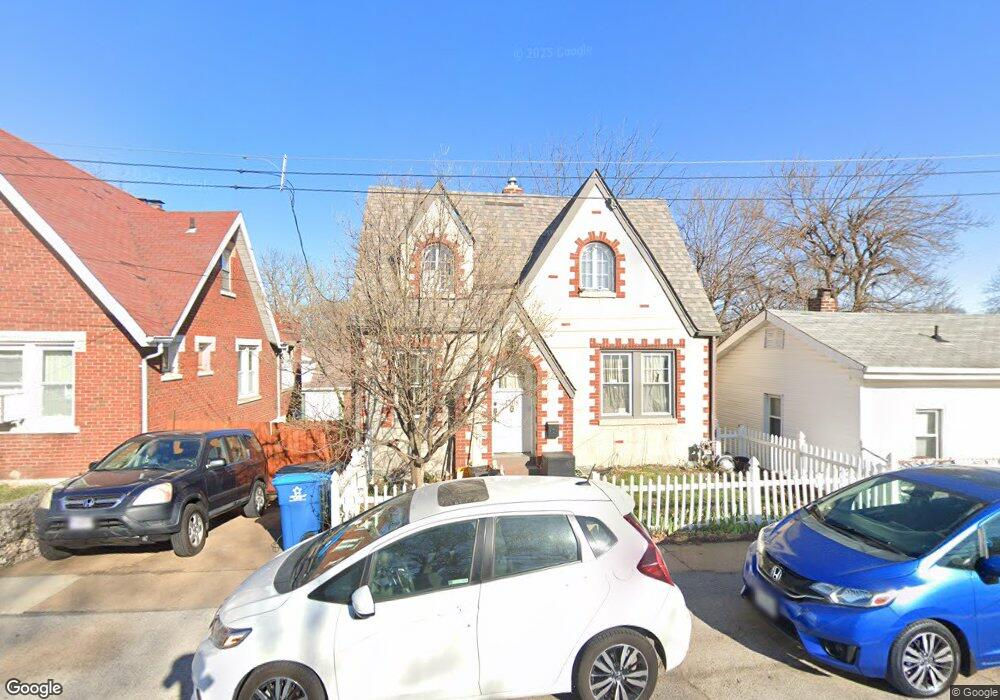
1708 Telegraph Rd Saint Louis, MO 63125
Lemay NeighborhoodEstimated Value: $174,954 - $191,000
4
Beds
3
Baths
1,128
Sq Ft
$163/Sq Ft
Est. Value
About This Home
This home is located at 1708 Telegraph Rd, Saint Louis, MO 63125 and is currently estimated at $183,489, approximately $162 per square foot. 1708 Telegraph Rd is a home located in St. Louis County with nearby schools including Hancock Place Elementary School, Hancock Place Middle School, and Hancock Place High School.
Ownership History
Date
Name
Owned For
Owner Type
Purchase Details
Closed on
Oct 28, 2013
Sold by
Burrus James C and Burrus Katharine C
Bought by
Stage Branden R
Current Estimated Value
Home Financials for this Owner
Home Financials are based on the most recent Mortgage that was taken out on this home.
Original Mortgage
$94,260
Outstanding Balance
$72,837
Interest Rate
5.25%
Mortgage Type
FHA
Estimated Equity
$110,652
Purchase Details
Closed on
Mar 10, 2010
Sold by
Federal Home Loan Mortgage Corporation
Bought by
Burrus James C and Burrus Katharine E
Home Financials for this Owner
Home Financials are based on the most recent Mortgage that was taken out on this home.
Original Mortgage
$65,600
Interest Rate
4.91%
Mortgage Type
New Conventional
Purchase Details
Closed on
Dec 24, 2009
Sold by
Dodd Nicole L and Dodd Chad E
Bought by
Chase Home Finance Llc
Purchase Details
Closed on
Dec 16, 2009
Sold by
Chase Home Finance Llc
Bought by
Federal Home Loan Mortgage Corp
Purchase Details
Closed on
Jul 5, 2007
Sold by
Porter Dean R
Bought by
Dodd Chad E and Dodd Nicole L
Home Financials for this Owner
Home Financials are based on the most recent Mortgage that was taken out on this home.
Original Mortgage
$144,500
Interest Rate
6.54%
Mortgage Type
Purchase Money Mortgage
Purchase Details
Closed on
Dec 28, 2006
Sold by
Deutsche Bank Trust Co
Bought by
Porter Dean R
Home Financials for this Owner
Home Financials are based on the most recent Mortgage that was taken out on this home.
Original Mortgage
$50,250
Interest Rate
6.1%
Mortgage Type
New Conventional
Purchase Details
Closed on
Aug 17, 2006
Sold by
Thompson Neal and Thompson Nicole
Bought by
Deutsche Bank Trust Co and Argent Mortgage Securities Inc Asset Bac
Purchase Details
Closed on
Mar 3, 2006
Sold by
Thompson Neal and Thompson Nicole
Bought by
Thompson Neal and Thompson Nicole
Purchase Details
Closed on
Oct 21, 1999
Sold by
Hud
Bought by
Thompson Neal
Home Financials for this Owner
Home Financials are based on the most recent Mortgage that was taken out on this home.
Original Mortgage
$44,000
Interest Rate
7.83%
Purchase Details
Closed on
Aug 19, 1999
Sold by
Hill Rodney D and Hill Connie L
Bought by
Delmar Financial Company
Purchase Details
Closed on
Dec 23, 1996
Sold by
Doran Realty Company
Bought by
Hill Rodney D and Hill Connie L
Home Financials for this Owner
Home Financials are based on the most recent Mortgage that was taken out on this home.
Original Mortgage
$64,400
Interest Rate
7.54%
Mortgage Type
FHA
Create a Home Valuation Report for This Property
The Home Valuation Report is an in-depth analysis detailing your home's value as well as a comparison with similar homes in the area
Home Values in the Area
Average Home Value in this Area
Purchase History
| Date | Buyer | Sale Price | Title Company |
|---|---|---|---|
| Stage Branden R | $96,000 | Us Title Main | |
| Burrus James C | $82,000 | None Available | |
| Chase Home Finance Llc | $140,000 | None Available | |
| Federal Home Loan Mortgage Corp | -- | None Available | |
| Dodd Chad E | $144,500 | None Available | |
| Porter Dean R | $67,000 | Etc | |
| Deutsche Bank Trust Co | $115,317 | None Available | |
| Thompson Neal | -- | None Available | |
| Thompson Neal | -- | -- | |
| Delmar Financial Company | $67,057 | -- | |
| Hud | -- | -- | |
| Hill Rodney D | -- | -- |
Source: Public Records
Mortgage History
| Date | Status | Borrower | Loan Amount |
|---|---|---|---|
| Open | Stage Branden R | $94,260 | |
| Previous Owner | Burrus James C | $65,600 | |
| Previous Owner | Dodd Chad E | $144,500 | |
| Previous Owner | Porter Dean R | $50,250 | |
| Previous Owner | Thompson Neal | $44,000 | |
| Previous Owner | Hill Rodney D | $64,400 |
Source: Public Records
Tax History Compared to Growth
Tax History
| Year | Tax Paid | Tax Assessment Tax Assessment Total Assessment is a certain percentage of the fair market value that is determined by local assessors to be the total taxable value of land and additions on the property. | Land | Improvement |
|---|---|---|---|---|
| 2025 | $1,918 | $34,540 | $6,760 | $27,780 |
| 2024 | $1,918 | $24,700 | $5,070 | $19,630 |
| 2023 | $1,821 | $24,700 | $5,070 | $19,630 |
| 2022 | $2,006 | $24,700 | $4,390 | $20,310 |
| 2021 | $1,971 | $27,250 | $4,390 | $22,860 |
| 2020 | $1,709 | $20,420 | $5,070 | $15,350 |
| 2019 | $1,705 | $20,420 | $5,070 | $15,350 |
| 2018 | $1,903 | $19,920 | $3,900 | $16,020 |
| 2017 | $1,870 | $19,920 | $3,900 | $16,020 |
| 2016 | $1,594 | $16,320 | $2,700 | $13,620 |
| 2015 | $1,599 | $16,320 | $2,700 | $13,620 |
| 2014 | $1,692 | $18,380 | $3,080 | $15,300 |
Source: Public Records
Map
Nearby Homes
- 1505 Telegraph Rd
- 1408 Dammert Ave
- 1424 Holden Ave
- 1680 Herault Place Unit F
- 1660 Blue Ridge Dr Unit G
- 1677 Herault Place Unit B
- 210 W Felton Ave
- 1678 Blue Ridge Dr Unit A
- 834 Catskill Dr
- 308 Carthage Ave
- 800 Dumont Place Unit E
- 1745 Herault Place Unit E
- 1745 Herault Place Unit F
- 800 Dumont Place Unit B
- 847 Catskill Dr
- 824 Dumont Place Unit C
- 156 W Holden Ave
- 149 W Felton Ave
- 853 Dumont Place Unit B
- 1716 Mayenne Ct Unit E
- 1706 Telegraph Rd
- 331 W Felton Ave
- 1710 Telegraph Rd
- 1704 Telegraph Rd
- 329 W Felton Ave
- 1800 Telegraph Rd
- 327 W Felton Ave
- 1700 Telegraph Rd
- 358 W Loretta Ave
- 325 W Felton Ave
- 1711 Telegraph Rd
- 326 W Felton Ave
- 1701 Telegraph Rd
- 1713 -1715 Telegraph Rd
- 356 W Loretta Ave
- 1713 Telegraph Rd
- 1801 Telegraph Rd
- 324 W Felton Ave
- 1806 Telegraph Rd