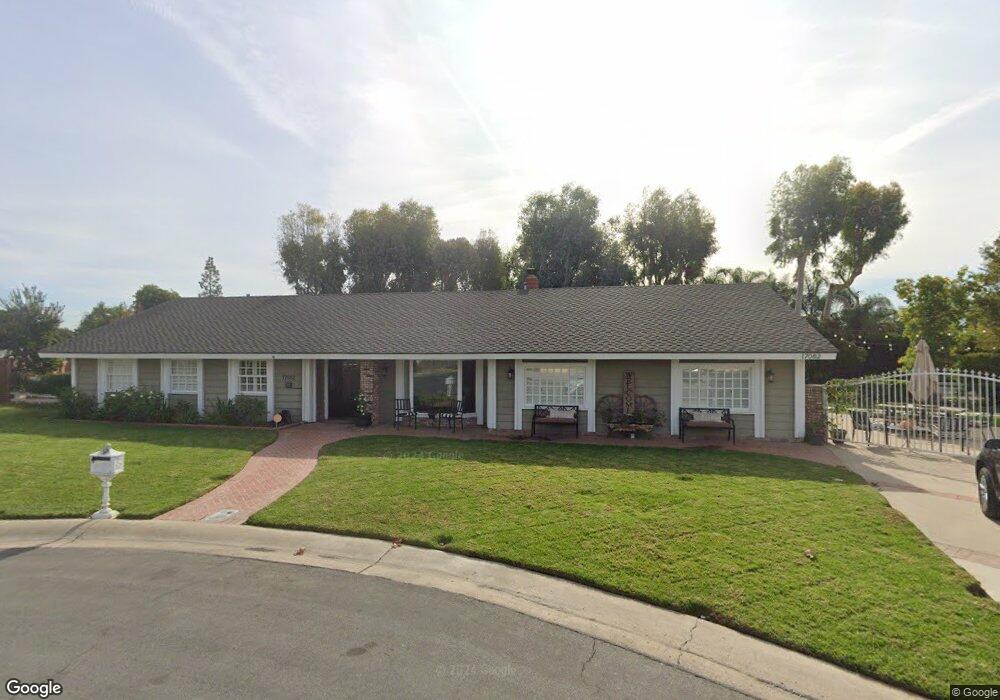
17082 Rancho Ln Yorba Linda, CA 92886
Estimated Value: $1,235,000 - $2,120,000
4
Beds
3
Baths
2,323
Sq Ft
$677/Sq Ft
Est. Value
About This Home
This home is located at 17082 Rancho Ln, Yorba Linda, CA 92886 and is currently estimated at $1,572,860, approximately $677 per square foot. 17082 Rancho Ln is a home located in Orange County with nearby schools including Rose Drive Elementary, Yorba Linda Middle School, and El Dorado High School.
Ownership History
Date
Name
Owned For
Owner Type
Purchase Details
Closed on
Jun 17, 2024
Sold by
Greaves Seaneen
Bought by
Greaves Seaneen Brigette
Current Estimated Value
Home Financials for this Owner
Home Financials are based on the most recent Mortgage that was taken out on this home.
Original Mortgage
$1,185,000
Outstanding Balance
$1,170,079
Interest Rate
7.09%
Mortgage Type
New Conventional
Estimated Equity
$402,781
Purchase Details
Closed on
Apr 6, 2020
Sold by
Greaves Robert Jeffrey and Greaves Seaneen B
Bought by
Greaves Robert Jeffrey and Greaves Seaneen B
Home Financials for this Owner
Home Financials are based on the most recent Mortgage that was taken out on this home.
Original Mortgage
$649,000
Interest Rate
3.4%
Mortgage Type
New Conventional
Purchase Details
Closed on
Jul 11, 2011
Sold by
Greaves Robert J and Greaves Seaneen B
Bought by
Greaves Robert J and Greaves Seaneen B
Create a Home Valuation Report for This Property
The Home Valuation Report is an in-depth analysis detailing your home's value as well as a comparison with similar homes in the area
Home Values in the Area
Average Home Value in this Area
Purchase History
| Date | Buyer | Sale Price | Title Company |
|---|---|---|---|
| Greaves Seaneen Brigette | -- | California Best Title | |
| Greaves Robert Jeffrey | -- | Wfg Title Company | |
| Greaves Robert J | -- | None Available |
Source: Public Records
Mortgage History
| Date | Status | Borrower | Loan Amount |
|---|---|---|---|
| Open | Greaves Seaneen Brigette | $1,185,000 | |
| Previous Owner | Greaves Robert Jeffrey | $649,000 |
Source: Public Records
Tax History Compared to Growth
Tax History
| Year | Tax Paid | Tax Assessment Tax Assessment Total Assessment is a certain percentage of the fair market value that is determined by local assessors to be the total taxable value of land and additions on the property. | Land | Improvement |
|---|---|---|---|---|
| 2025 | $6,650 | $564,678 | $208,772 | $355,906 |
| 2024 | $6,650 | $553,606 | $204,678 | $348,928 |
| 2023 | $6,451 | $542,751 | $200,664 | $342,087 |
| 2022 | $5,815 | $479,742 | $196,729 | $283,013 |
| 2021 | $4,740 | $393,329 | $192,872 | $200,457 |
| 2020 | $4,636 | $389,296 | $190,894 | $198,402 |
| 2019 | $4,476 | $381,663 | $187,151 | $194,512 |
| 2018 | $4,418 | $374,180 | $183,481 | $190,699 |
| 2017 | $4,346 | $366,844 | $179,884 | $186,960 |
| 2016 | $4,258 | $359,651 | $176,356 | $183,295 |
| 2015 | $4,206 | $354,249 | $173,707 | $180,542 |
| 2014 | $4,082 | $347,310 | $170,304 | $177,006 |
Source: Public Records
Map
Nearby Homes
- 4654 Prospect Ln
- 4781 Kona Kove Way
- 4802 Brookway Ave
- 11715 Rose Dr
- 16692 Meadowview Dr
- 1429 Prospect Ave Unit B
- 4215 Sand Rock Cir
- 4571 Mimosa Dr
- 17001 La Kenice Way
- 4942 Gem Ln
- 943 Berkenstock Ln
- 5130 Webb Place
- 4882 Kermath St
- 17956 Joshua Dr
- 16942 Lake Park Way
- 16950 Lake Park Way Unit 7
- 16742 Lake Park Way
- 3744 Lake Grove Dr Unit 21
- 5418 Saratoga St
- 4891 Eureka Ave Unit 25
- 17062 Rancho Ln
- 4611 Santa fe St
- 17092 Rancho Ln
- 17071 Rancho Ln
- 17081 Rancho Ln
- 4602 Santa fe St
- 17061 Rancho Ln
- 17052 Rancho Ln
- 4641 Santa fe St
- 4612 Santa fe St
- 4622 Santa fe St
- 17082 El Cajon Ave
- 17072 El Cajon Ave
- 4521 Casa Oro Dr
- 17051 Rancho Ln
- 4531 Casa Oro Dr
- 4642 Santa fe St
- 17042 Rancho Ln
- 17132 El Cajon Ave
- 4634 Prospect Ln