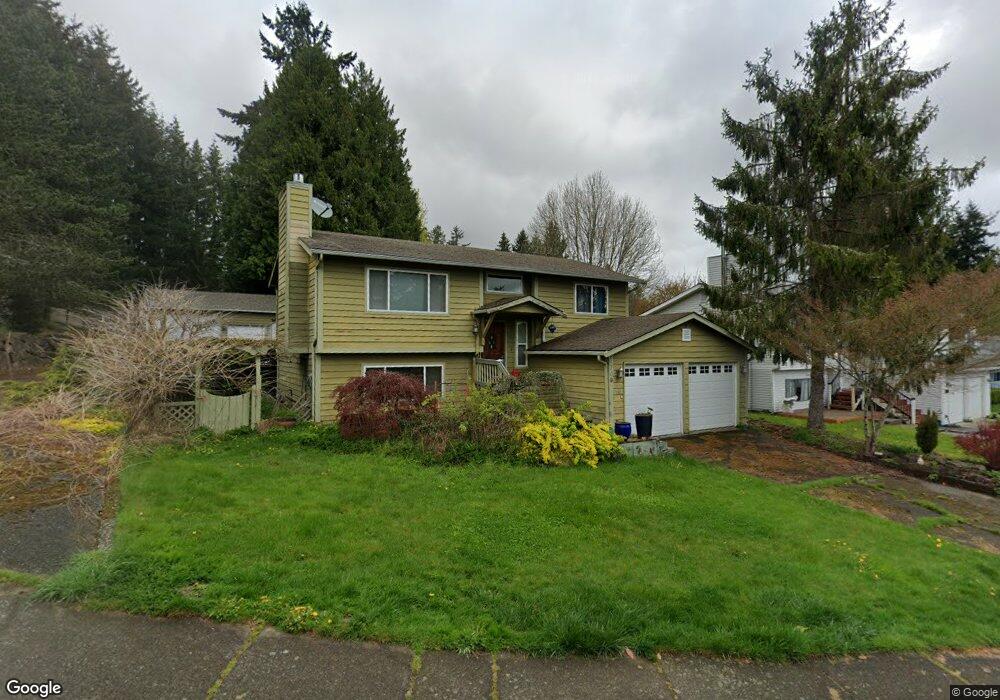
1709 172nd St SE Bothell, WA 98012
North Creek NeighborhoodEstimated Value: $770,000 - $820,000
3
Beds
2
Baths
1,518
Sq Ft
$524/Sq Ft
Est. Value
About This Home
This home is located at 1709 172nd St SE, Bothell, WA 98012 and is currently estimated at $795,753, approximately $524 per square foot. 1709 172nd St SE is a home located in Snohomish County with nearby schools including Woodside Elementary School, Heatherwood Middle School, and Henry M. Jackson High School.
Ownership History
Date
Name
Owned For
Owner Type
Purchase Details
Closed on
Mar 1, 2004
Sold by
Ianetta Steven and Ianetta Erica
Bought by
Thane John T and Thane Kia C
Current Estimated Value
Home Financials for this Owner
Home Financials are based on the most recent Mortgage that was taken out on this home.
Original Mortgage
$208,000
Outstanding Balance
$92,024
Interest Rate
5.57%
Mortgage Type
Purchase Money Mortgage
Estimated Equity
$703,729
Purchase Details
Closed on
Jul 6, 2000
Sold by
Ianetta Erica Stacey
Bought by
Ianetta Steven James
Purchase Details
Closed on
Aug 16, 1996
Sold by
Harb Maher I and Harb Sona
Bought by
Ianetta Steven J and Ianetta Erica S
Home Financials for this Owner
Home Financials are based on the most recent Mortgage that was taken out on this home.
Original Mortgage
$132,000
Interest Rate
8.42%
Create a Home Valuation Report for This Property
The Home Valuation Report is an in-depth analysis detailing your home's value as well as a comparison with similar homes in the area
Home Values in the Area
Average Home Value in this Area
Purchase History
| Date | Buyer | Sale Price | Title Company |
|---|---|---|---|
| Thane John T | $264,000 | Stewart Title Company Of Sno | |
| Ianetta Steven James | -- | -- | |
| Ianetta Steven J | $165,000 | Old Republic Title Ltd |
Source: Public Records
Mortgage History
| Date | Status | Borrower | Loan Amount |
|---|---|---|---|
| Open | Thane John T | $208,000 | |
| Previous Owner | Ianetta Steven J | $132,000 | |
| Closed | Thane John T | $52,000 |
Source: Public Records
Tax History
| Year | Tax Paid | Tax Assessment Tax Assessment Total Assessment is a certain percentage of the fair market value that is determined by local assessors to be the total taxable value of land and additions on the property. | Land | Improvement |
|---|---|---|---|---|
| 2026 | $7,497 | $784,000 | $560,000 | $224,000 |
| 2025 | $6,965 | $775,900 | $525,000 | $250,900 |
| 2024 | $6,965 | $723,700 | $480,000 | $243,700 |
| 2023 | $7,272 | $828,800 | $555,000 | $273,800 |
| 2022 | $6,156 | $606,700 | $369,000 | $237,700 |
| 2020 | $6,072 | $503,200 | $290,000 | $213,200 |
| 2019 | $5,726 | $475,900 | $270,000 | $205,900 |
| 2018 | $5,548 | $420,000 | $230,000 | $190,000 |
| 2017 | $4,846 | $368,900 | $190,000 | $178,900 |
| 2016 | $4,225 | $337,500 | $167,000 | $170,500 |
| 2015 | $4,230 | $320,500 | $164,000 | $156,500 |
| 2013 | $3,848 | $257,800 | $122,000 | $135,800 |
Source: Public Records
Map
Nearby Homes
- 1815 172nd St SE
- 1516 170th Place SE
- 16825 17th Ave SE
- 1621 Seattle Hill Rd Unit HH-2
- 1621 Seattle Hill Rd Unit Q3
- 1621 Seattle Hill Rd Unit JJ-3
- 1621 Seattle Hill Rd Unit K4
- 1621 Seattle Hill Rd Unit J5
- 1621 Seattle Hill Rd Unit C4
- 1621 Seattle Hill Rd Unit u-1
- 1325 Seattle Hill Rd Unit A2
- 1325 Seattle Hill Rd Unit A3
- 1325 Seattle Hill Rd Unit L2
- 17529 Brook Blvd
- 19524 16th Ave SE Unit C1
- 2502 166th Place SE
- 16225 15th Dr SE
- 1800 Mill Creek Rd Unit 8B
- 1800 Mill Creek Rd Unit 56A
- 16101 Bothell Everett Hwy Unit B202
- 1713 172nd St SE
- 1702 171st Place SE
- 1714 171st Place SE
- 1616 172nd St SE
- 1723 172nd St SE
- 1628 172nd St SE
- 1710 172nd St SE
- 17132 17th Ave SE
- 1610 172nd St SE
- 1731 172nd St SE
- 1730 171st Place SE
- 17126 17th Ave SE
- 1611 172nd St SE
- 17220 17th Dr SE
- 17305 16th Dr SE
- 1604 172nd St SE
- 17120 17th Ave SE
- 1605 172nd St SE
- 1801 172nd St SE
- 17108 17th Ave SE
Your Personal Tour Guide
Ask me questions while you tour the home.