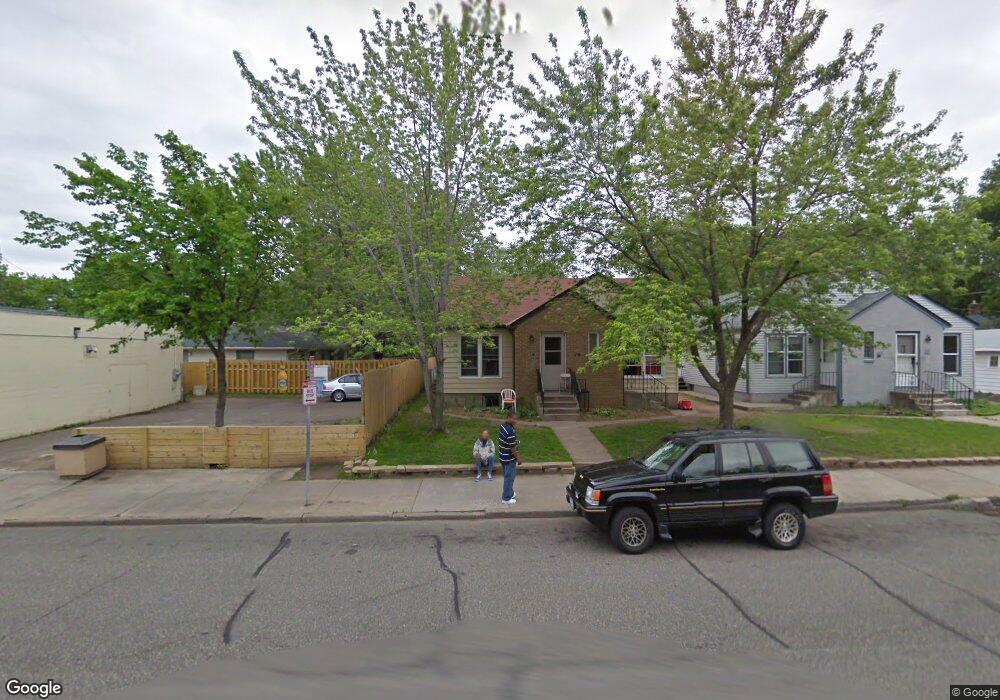
1709 44th Ave N Minneapolis, MN 55412
Webber-Camden NeighborhoodEstimated Value: $290,000 - $303,000
6
Beds
2
Baths
1,729
Sq Ft
$171/Sq Ft
Est. Value
About This Home
This home is located at 1709 44th Ave N, Minneapolis, MN 55412 and is currently estimated at $296,373, approximately $171 per square foot. 1709 44th Ave N is a home located in Hennepin County with nearby schools including Loring Elementary School, Olson Middle School, and Sojourner Truth Academy.
Ownership History
Date
Name
Owned For
Owner Type
Purchase Details
Closed on
Jan 6, 2023
Sold by
Dsquare Investment Group Llc
Bought by
Dsquare Investment Group Llc
Current Estimated Value
Purchase Details
Closed on
Dec 19, 2019
Sold by
Thong Dinh
Bought by
County Of Hennepin
Purchase Details
Closed on
Nov 27, 2019
Sold by
Larson Andrew and Larson Larissa
Bought by
Thong Dinh
Purchase Details
Closed on
Dec 28, 2018
Sold by
Yosemite Properties Llc
Bought by
Larson Andrew and Larson Lasissa
Purchase Details
Closed on
Oct 28, 2018
Sold by
Yousemite Proepries Llc
Bought by
Larson Andrew and Larson Larissa
Purchase Details
Closed on
Jan 23, 2017
Sold by
Larson Andrew L and Larson Larisa J
Bought by
Yosemite Properties Llc
Purchase Details
Closed on
Aug 29, 2002
Sold by
Gillis Deborah D
Bought by
Larson Andrew J and Larson Ann M
Purchase Details
Closed on
Jun 6, 2001
Sold by
Kirkpatrick Melissa B
Bought by
Gillis Deborah D
Create a Home Valuation Report for This Property
The Home Valuation Report is an in-depth analysis detailing your home's value as well as a comparison with similar homes in the area
Home Values in the Area
Average Home Value in this Area
Purchase History
| Date | Buyer | Sale Price | Title Company |
|---|---|---|---|
| Dsquare Investment Group Llc | $500 | -- | |
| County Of Hennepin | -- | None Available | |
| Thong Dinh | $220,000 | Results Title | |
| Larson Andrew | $500 | None Listed On Document | |
| Larson Andrew | -- | None Available | |
| Yosemite Properties Llc | $515 | None Available | |
| Larson Andrew J | $281,500 | -- | |
| Gillis Deborah D | $128,000 | -- |
Source: Public Records
Tax History Compared to Growth
Tax History
| Year | Tax Paid | Tax Assessment Tax Assessment Total Assessment is a certain percentage of the fair market value that is determined by local assessors to be the total taxable value of land and additions on the property. | Land | Improvement |
|---|---|---|---|---|
| 2024 | $8,169 | $279,000 | $31,000 | $248,000 |
| 2023 | $4,801 | $276,000 | $26,000 | $250,000 |
| 2022 | $4,431 | $250,000 | $18,000 | $232,000 |
| 2021 | $3,760 | $231,000 | $8,000 | $223,000 |
| 2020 | $3,370 | $231,000 | $25,800 | $205,200 |
| 2019 | $3,149 | $192,500 | $17,600 | $174,900 |
| 2018 | $2,665 | $175,000 | $17,600 | $157,400 |
| 2017 | $2,373 | $128,000 | $16,000 | $112,000 |
| 2016 | $2,226 | $116,500 | $16,000 | $100,500 |
| 2015 | $2,284 | $114,000 | $16,000 | $98,000 |
| 2014 | -- | $103,500 | $16,000 | $87,500 |
Source: Public Records
Map
Nearby Homes
- 4344 Irving Ave N
- 1801 44th Ave N
- 1806 44th Ave N
- 4334 Fremont Ave N
- 4110 Irving Ave N
- 4411 Oliver Ave N
- 4635 Emerson Ave N
- 4643 Emerson Ave N
- 4502 Colfax Ave N
- 4610 Oliver Ave N
- 4701 Dupont Ave N
- 4625 Oliver Ave N
- 4106 Dupont Ave N
- 4543 Aldrich Ave N
- 4111 Bryant Ave N
- 4021 Colfax Ave N
- 4010 Dupont Ave N
- 3951 Penn Ave N
- 4114 Aldrich Ave N
- 4715 Camden Ave N
- 1715 44th Ave N
- 4359 James Ave N
- 1701 44th Ave N
- 4355 James Ave N
- 4350 Knox Ave N
- 4354 Knox Ave N
- 4346 Knox Ave N
- 4347 James Ave N
- 4342 Knox Ave N
- 1626 44th Ave N
- 1626 1626 44th-Avenue-n
- 1618 44th Ave N
- 1618/20 44th Ave N
- 4338 Knox Ave N
- 1625 44th Ave N
- 1625 1625 44th-Avenue-n
- 1704 44th Ave N
- 4343 James Ave N
- 1616 44th Ave N
- 1710 44th Ave N