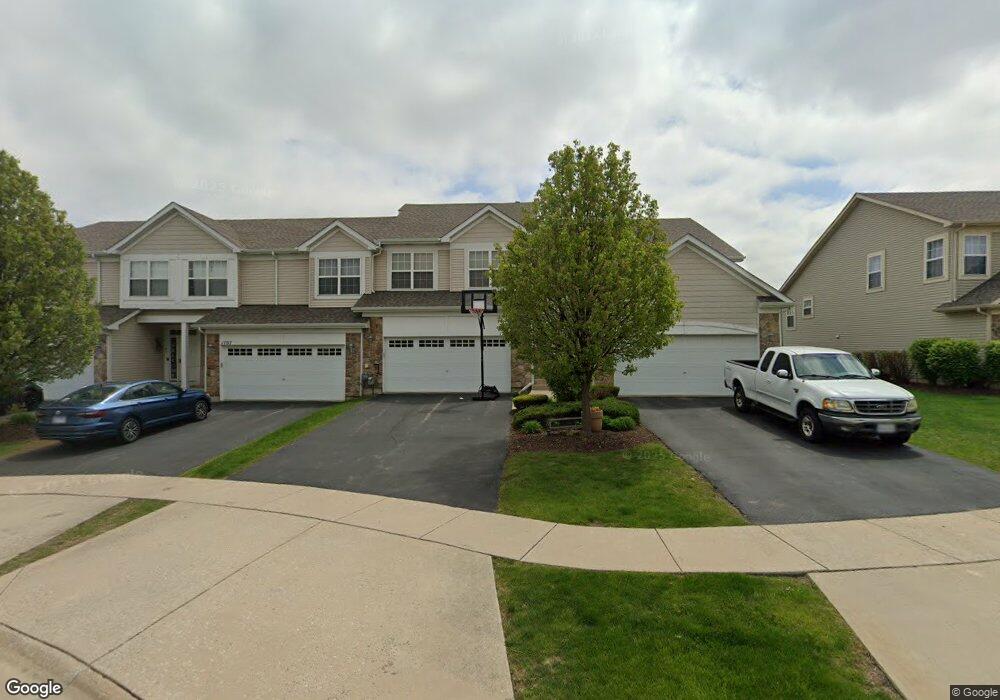
1709 Fieldstone Ct Unit 489 Shorewood, IL 60404
Estimated Value: $289,174 - $305,000
2
Beds
2
Baths
1,818
Sq Ft
$163/Sq Ft
Est. Value
About This Home
This home is located at 1709 Fieldstone Ct Unit 489, Shorewood, IL 60404 and is currently estimated at $296,044, approximately $162 per square foot. 1709 Fieldstone Ct Unit 489 is a home located in Will County with nearby schools including Walnut Trails Elementary School, Minooka Junior High School, and Minooka Intermediate School.
Ownership History
Date
Name
Owned For
Owner Type
Purchase Details
Closed on
Dec 18, 2020
Sold by
Glavin Edward and Glavin Lynn
Bought by
Glavin Kathryn A
Current Estimated Value
Purchase Details
Closed on
Dec 12, 2020
Sold by
Glavin Edward and Glavin Lynn
Bought by
Glavin Kathryn A
Purchase Details
Closed on
Jun 9, 2017
Sold by
Eneix Shaun M and Eneix Shawn M
Bought by
Glavin Edward and Glavin Lynn
Purchase Details
Closed on
Jun 21, 2008
Sold by
Mccarthy Steven M
Bought by
Eneix Shawn M
Home Financials for this Owner
Home Financials are based on the most recent Mortgage that was taken out on this home.
Original Mortgage
$164,592
Interest Rate
6.5%
Mortgage Type
Purchase Money Mortgage
Purchase Details
Closed on
Oct 28, 2005
Sold by
Kipling Townes Llc
Bought by
Mccarthy Steven M
Home Financials for this Owner
Home Financials are based on the most recent Mortgage that was taken out on this home.
Original Mortgage
$17,097
Interest Rate
5.98%
Mortgage Type
Credit Line Revolving
Create a Home Valuation Report for This Property
The Home Valuation Report is an in-depth analysis detailing your home's value as well as a comparison with similar homes in the area
Home Values in the Area
Average Home Value in this Area
Purchase History
| Date | Buyer | Sale Price | Title Company |
|---|---|---|---|
| Glavin Kathryn A | -- | Chicago Title | |
| Glavin Kathryn A | -- | Accommodation | |
| Glavin Edward | $182,000 | Chicago Title | |
| Eneix Shawn M | $182,000 | Stewart Title Company | |
| Mccarthy Steven M | $214,000 | Lawyers |
Source: Public Records
Mortgage History
| Date | Status | Borrower | Loan Amount |
|---|---|---|---|
| Previous Owner | Eneix Shawn M | $164,592 | |
| Previous Owner | Mccarthy Steven M | $17,097 |
Source: Public Records
Tax History Compared to Growth
Tax History
| Year | Tax Paid | Tax Assessment Tax Assessment Total Assessment is a certain percentage of the fair market value that is determined by local assessors to be the total taxable value of land and additions on the property. | Land | Improvement |
|---|---|---|---|---|
| 2024 | $5,633 | $81,996 | $12,990 | $69,006 |
| 2023 | $5,633 | $73,671 | $11,671 | $62,000 |
| 2022 | $4,976 | $69,712 | $11,044 | $58,668 |
| 2021 | $4,672 | $65,580 | $10,389 | $55,191 |
| 2020 | $4,537 | $62,967 | $10,389 | $52,578 |
| 2019 | $4,439 | $60,400 | $9,965 | $50,435 |
| 2018 | $4,094 | $55,515 | $9,965 | $45,550 |
| 2017 | $3,895 | $52,475 | $9,965 | $42,510 |
| 2016 | $3,737 | $49,880 | $9,965 | $39,915 |
| 2015 | $3,002 | $45,935 | $8,835 | $37,100 |
| 2014 | $3,002 | $43,064 | $8,835 | $34,229 |
| 2013 | $3,002 | $43,064 | $8,835 | $34,229 |
Source: Public Records
Map
Nearby Homes
- 1632 Fieldstone Dr S Unit 2
- 1794 Fieldstone Dr N Unit 1794
- 1713 Fieldstone Dr N
- 1604 Augusta Ln
- 21037 Coventry Cir
- 25226 Balmoral Dr
- 25102 Old Oak Ln
- 1018 Butterfield Cir E Unit 5
- 21059 Somerset St
- 0000 W Seil Rd
- 760 Pleasant Dr
- 709 Flag Dr
- 704 Flag Dr
- 21340 Somerset St
- 636 Flag Dr
- 24951 W Lake Forrest Ln
- 21350 S Forest View Dr
- 21246 Woodland Way
- 621 Pleasant Dr
- 22020 S River Rd
- 1707 Fieldstone Ct Unit 488
- 1705 Fieldstone Ct Unit 487
- 1701 Fieldstone Ct Unit 485
- 1711 Fieldstone Ct Unit 490
- 1709 Fieldstone Ct Unit 5
- 1701 Fieldstone Ct Unit 48
- 1696 Fieldstone Dr S Unit 6
- 1706 Fieldstone Dr S Unit 1
- 1704 Fieldstone Dr S Unit 2
- 1698 Fieldstone Dr S Unit 5
- 1700 Fieldstone Dr S
- 1702 Fieldstone Dr S
- 1704 Fieldstone Dr S Unit 1704
- 1696 Fieldstone Dr S Unit 1696
- 1702 Fieldstone Ct Unit 483
- 1710 Fieldstone Ct Unit 479
- 1708 Fieldstone Ct Unit 480
- 1700 Fieldstone Ct Unit 484
- 1706 Fieldstone Ct Unit 481