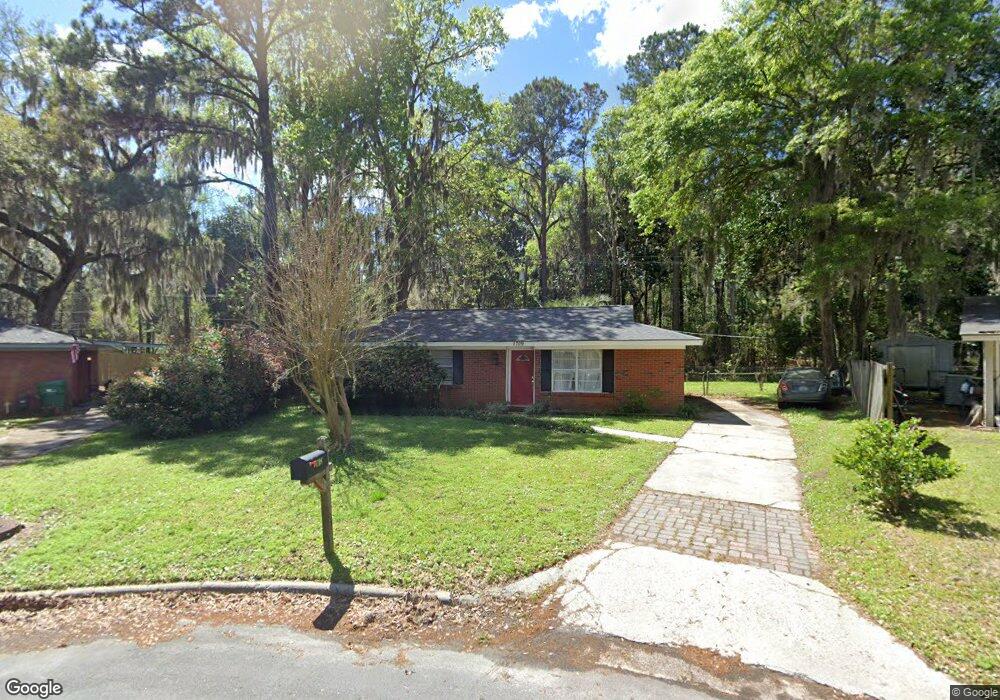
1709 Kings Way Ct Savannah, GA 31406
Cresthill NeighborhoodEstimated Value: $266,000 - $286,000
3
Beds
1
Bath
1,094
Sq Ft
$252/Sq Ft
Est. Value
About This Home
This home is located at 1709 Kings Way Ct, Savannah, GA 31406 and is currently estimated at $275,785, approximately $252 per square foot. 1709 Kings Way Ct is a home located in Chatham County with nearby schools including Hesse School, Jenkins High School, and St. James Catholic School.
Ownership History
Date
Name
Owned For
Owner Type
Purchase Details
Closed on
Oct 1, 2020
Sold by
Lago Ramon J
Bought by
Singleton Kristin N and Singleton Kristofer L
Current Estimated Value
Home Financials for this Owner
Home Financials are based on the most recent Mortgage that was taken out on this home.
Original Mortgage
$158,462
Outstanding Balance
$140,944
Interest Rate
2.9%
Mortgage Type
VA
Estimated Equity
$134,842
Purchase Details
Closed on
Mar 1, 2018
Sold by
Travis Todd M
Bought by
Lago Alyssa M and Lago Ramon J
Home Financials for this Owner
Home Financials are based on the most recent Mortgage that was taken out on this home.
Original Mortgage
$110,250
Interest Rate
4.22%
Mortgage Type
New Conventional
Purchase Details
Closed on
Apr 26, 2007
Sold by
Not Provided
Bought by
Travis Todd M and Travis Gina L
Home Financials for this Owner
Home Financials are based on the most recent Mortgage that was taken out on this home.
Original Mortgage
$90,250
Interest Rate
8.45%
Mortgage Type
New Conventional
Create a Home Valuation Report for This Property
The Home Valuation Report is an in-depth analysis detailing your home's value as well as a comparison with similar homes in the area
Home Values in the Area
Average Home Value in this Area
Purchase History
| Date | Buyer | Sale Price | Title Company |
|---|---|---|---|
| Singleton Kristin N | $154,900 | -- | |
| Lago Alyssa M | $122,500 | -- | |
| Travis Todd M | $95,000 | -- |
Source: Public Records
Mortgage History
| Date | Status | Borrower | Loan Amount |
|---|---|---|---|
| Open | Singleton Kristin N | $158,462 | |
| Previous Owner | Lago Alyssa M | $110,250 | |
| Previous Owner | Travis Todd M | $90,250 |
Source: Public Records
Tax History Compared to Growth
Tax History
| Year | Tax Paid | Tax Assessment Tax Assessment Total Assessment is a certain percentage of the fair market value that is determined by local assessors to be the total taxable value of land and additions on the property. | Land | Improvement |
|---|---|---|---|---|
| 2025 | $1,432 | $106,560 | $24,000 | $82,560 |
| 2024 | $1,432 | $82,720 | $15,440 | $67,280 |
| 2023 | $699 | $72,320 | $15,440 | $56,880 |
| 2022 | $1,182 | $66,960 | $15,440 | $51,520 |
| 2021 | $1,260 | $51,480 | $15,440 | $36,040 |
| 2020 | $1,190 | $40,080 | $15,440 | $24,640 |
| 2019 | $1,275 | $39,640 | $15,440 | $24,200 |
| 2018 | $1,355 | $39,240 | $15,440 | $23,800 |
| 2017 | $1,338 | $40,000 | $15,440 | $24,560 |
| 2016 | $1,380 | $40,160 | $15,440 | $24,720 |
| 2015 | $1,397 | $40,600 | $15,440 | $25,160 |
| 2014 | $2,066 | $41,120 | $0 | $0 |
Source: Public Records
Map
Nearby Homes
- 105 Kings Ct
- 109 Kings Ct
- 6 Prince Charles Ct
- 1602 Kings Way
- 1411 Blakeley Rd
- 1 Patron Ct
- 1345 Lavon Ave
- 8813 Whitefield Ave
- 9143 Ferguson Ave
- 8623 W Creighton Place
- 8519 Cresthill Ave
- 8518 Whitefield Ave
- 606 Rivers End Dr
- 17 Tara Ct
- 8708 Clarke Ave
- 822 Dancy Ave
- 8516 Vining Way
- 844 Dancy Ave
- 8621 Ferguson Ave
- 8615 Hurst Ave
- 1709 Kings Way Ct
- 1711 Kings Way Ct
- 1713 Kings Way Ct
- 1713 Kings Way Ct
- 1705 Kings Way Ct
- 1715 Kings Way Ct
- 9204 King Edward Dr
- 9202 King Edward Dr
- 1717 Kings Way Ct
- 1703 Kings Way
- 1721 Kings Way
- 9206 King Edward Dr
- 1723 Kings Way
- 1704 Kings Way
- 1783 Kings Way
- 1631 Kings Way
- 1706 Kings Way
- 102 Kings Ct
- 1725 Kings Way
- 1736 Kings Way