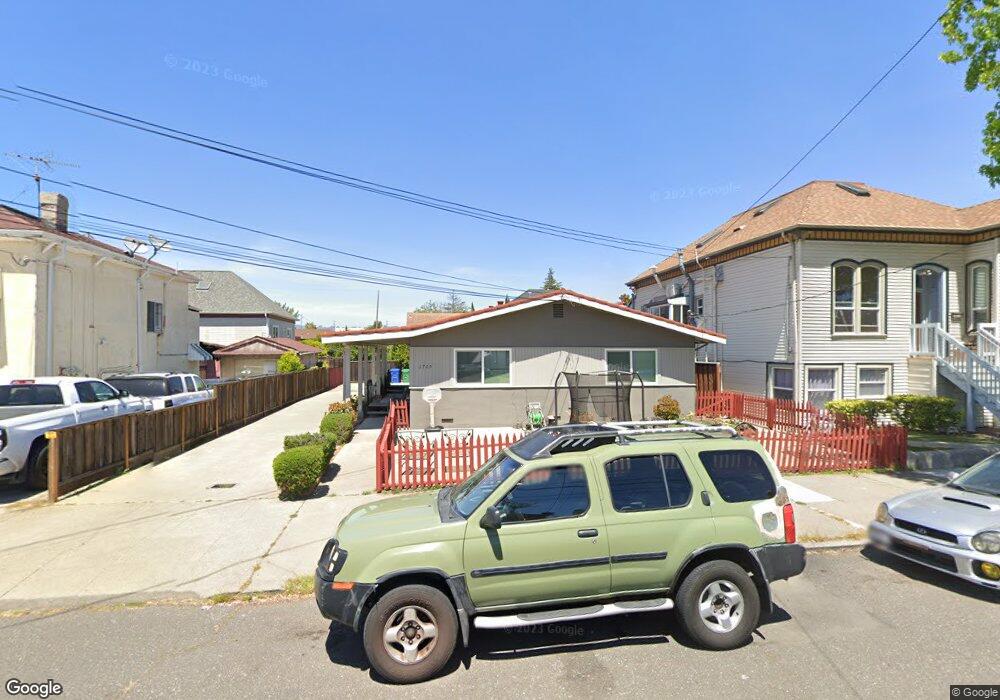
1709 Pacific Ave Alameda, CA 94501
West Alameda NeighborhoodEstimated Value: $1,061,000 - $1,246,774
4
Beds
2
Baths
1,800
Sq Ft
$620/Sq Ft
Est. Value
About This Home
This home is located at 1709 Pacific Ave, Alameda, CA 94501 and is currently estimated at $1,116,194, approximately $620 per square foot. 1709 Pacific Ave is a home located in Alameda County with nearby schools including Maya Lin School, Will C. Wood Middle School, and Encinal Junior/Senior High.
Ownership History
Date
Name
Owned For
Owner Type
Purchase Details
Closed on
Oct 21, 2024
Sold by
Daniel Yee And Annie K Wong Revocable Tr and Yee Daniel
Bought by
Yee Tyler J and Chernick Carly
Current Estimated Value
Home Financials for this Owner
Home Financials are based on the most recent Mortgage that was taken out on this home.
Original Mortgage
$0
Interest Rate
6.2%
Mortgage Type
Seller Take Back
Purchase Details
Closed on
Jan 26, 2017
Sold by
Yee Daniel
Bought by
Yee Daniel and Wong Annie K
Purchase Details
Closed on
Mar 11, 2016
Sold by
Yee Yee Daniel Daniel and Yee Sam Jim
Bought by
Yee Daniel and Yee Davie
Purchase Details
Closed on
Apr 1, 2011
Sold by
Yee Sam Jim and Yee Judy S
Bought by
Yee Sam Jim and Yee Judy S
Purchase Details
Closed on
Jul 30, 2004
Sold by
Yee Sam Jim and Yee Judy
Bought by
Yee Sam Jim and Yee Judy S
Create a Home Valuation Report for This Property
The Home Valuation Report is an in-depth analysis detailing your home's value as well as a comparison with similar homes in the area
Home Values in the Area
Average Home Value in this Area
Purchase History
We collect this data history from publicly available records. To have your information removed, we recommend requesting removal directly through your county’s website.
| Date | Buyer | Sale Price | Title Company |
|---|---|---|---|
| Yee Tyler J | $1,000,000 | Wfg National Title Insurance C | |
| Yee Daniel | -- | None Available | |
| Yee Daniel | -- | None Available | |
| Yee Sam Jim | -- | None Available | |
| Yee Sam Jim | -- | -- |
Source: Public Records
Mortgage History
We collect this data history from publicly available records. To have your information removed, we recommend requesting removal directly through your county’s website.
| Date | Status | Borrower | Loan Amount |
|---|---|---|---|
| Closed | Yee Tyler J | $0 | |
| Closed | Yee Tyler J | $0 |
Source: Public Records
Tax History
| Year | Tax Paid | Tax Assessment Tax Assessment Total Assessment is a certain percentage of the fair market value that is determined by local assessors to be the total taxable value of land and additions on the property. | Land | Improvement |
|---|---|---|---|---|
| 2025 | $3,809 | $1,000,000 | $300,000 | $700,000 |
| 2024 | $3,809 | $90,349 | $52,160 | $45,189 |
| 2023 | $3,715 | $95,441 | $51,138 | $44,303 |
| 2022 | $3,645 | $86,570 | $50,135 | $43,435 |
| 2021 | $3,582 | $84,735 | $49,152 | $42,583 |
| 2020 | $3,541 | $90,795 | $48,648 | $42,147 |
| 2019 | $2,955 | $89,014 | $47,694 | $41,320 |
| 2018 | $2,897 | $87,269 | $46,759 | $40,510 |
| 2017 | $2,821 | $85,558 | $45,842 | $39,716 |
| 2016 | $2,211 | $83,881 | $44,944 | $38,937 |
| 2015 | $2,185 | $82,621 | $44,269 | $38,352 |
| 2014 | $2,159 | $81,002 | $43,401 | $37,601 |
Source: Public Records
Map
Nearby Homes
- 1628 Minturn St
- 1610 Pacific Ave
- 1726 Eagle Ave
- 1801 Buena Vista Ave
- 1712 Paru St
- 1712 Schiller St
- 1826 Pacific Ave
- 1921 Grand St
- 1925 Grand St
- 1933 Grand St
- 1670 Larkspur St
- 1679 Clement Ave
- 1912 Lafayette St
- 1918 Lafayette St
- 1523 Lincoln Ave
- 1815 Balsa St
- 2007 Stanford St
- 2011 Clement Ave
- 1401 Cottage St Unit D
- 2025 Stanford St
- 1709 Pacific Ave Unit B
- 1715 Pacific Ave
- 1705 Pacific Ave
- 1713 Minturn St
- 1708 Grand St
- 1710 Grand St
- 1701 Pacific Ave
- 1719 Minturn St
- 1716 Grand St
- 1704 Pacific Ave
- 1719 Pacific Ave
- 1708 Pacific Ave
- 1702 Pacific Ave
- 1712 Pacific Ave
- 1721 Minturn St
- 1714 Pacific Ave
- 1700 Pacific Ave
- 1718 Grand St
- 1723 Pacific Ave
- 1708 Minturn St
Your Personal Tour Guide
Ask me questions while you tour the home.