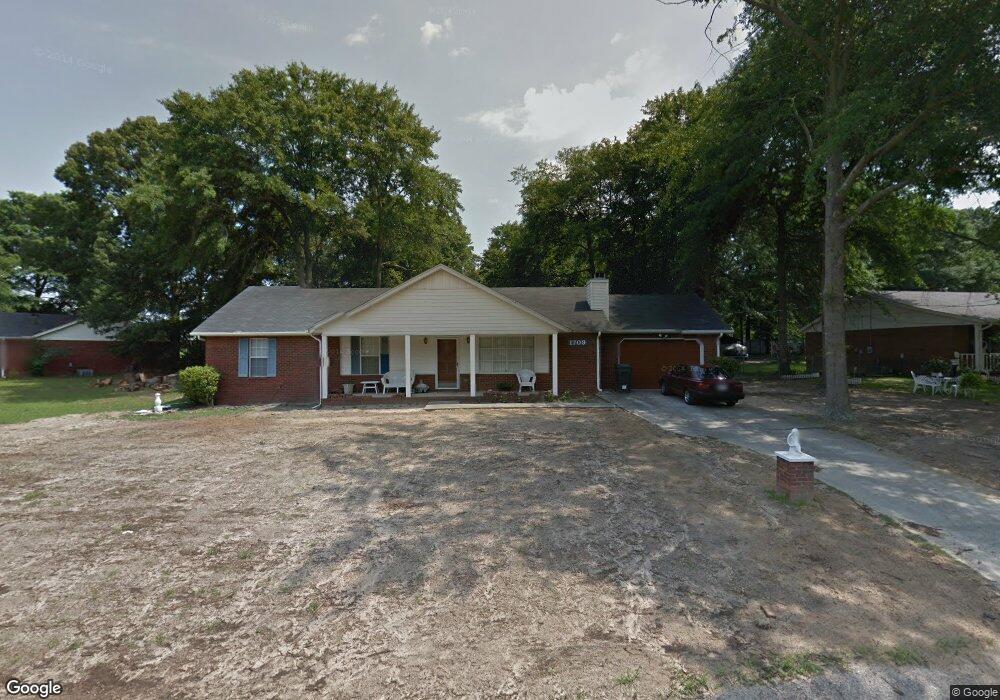
1709 Rusk Dr Hephzibah, GA 30815
McBean NeighborhoodEstimated Value: $215,000 - $259,282
4
Beds
3
Baths
2,100
Sq Ft
$117/Sq Ft
Est. Value
About This Home
This home is located at 1709 Rusk Dr, Hephzibah, GA 30815 and is currently estimated at $244,821, approximately $116 per square foot. 1709 Rusk Dr is a home located in Richmond County with nearby schools including McBean Elementary School, Pine Hill Middle School, and Johnson Magnet.
Ownership History
Date
Name
Owned For
Owner Type
Purchase Details
Closed on
Jan 21, 2010
Sold by
Secretary Of Veterans Affairs
Bought by
Johnson Mary A
Current Estimated Value
Home Financials for this Owner
Home Financials are based on the most recent Mortgage that was taken out on this home.
Original Mortgage
$78,570
Interest Rate
4.97%
Mortgage Type
VA
Purchase Details
Closed on
Feb 3, 2009
Sold by
Countrywide Home Loans Inc
Bought by
Secretary Of Veterans Affairs
Purchase Details
Closed on
May 5, 2003
Sold by
Eady Tyrone A
Bought by
Eady Lou E
Purchase Details
Closed on
Oct 13, 1998
Sold by
Sutphin Preston A
Bought by
Eady Tyrone A
Home Financials for this Owner
Home Financials are based on the most recent Mortgage that was taken out on this home.
Original Mortgage
$91,698
Interest Rate
6.8%
Mortgage Type
VA
Purchase Details
Closed on
May 23, 1993
Sold by
Sutphin Dorlena M E
Bought by
Sutphin Preston A
Purchase Details
Closed on
Apr 10, 1990
Sold by
John C Weaver Home
Bought by
Sutphin Preston A
Create a Home Valuation Report for This Property
The Home Valuation Report is an in-depth analysis detailing your home's value as well as a comparison with similar homes in the area
Home Values in the Area
Average Home Value in this Area
Purchase History
| Date | Buyer | Sale Price | Title Company |
|---|---|---|---|
| Johnson Mary A | -- | -- | |
| Secretary Of Veterans Affairs | -- | None Available | |
| Countrywide Home Loans Inc | $94,739 | None Available | |
| Eady Lou E | -- | -- | |
| Eady Tyrone A | $89,900 | -- | |
| Sutphin Preston A | -- | -- | |
| Sutphin Preston A | $70,200 | -- |
Source: Public Records
Mortgage History
| Date | Status | Borrower | Loan Amount |
|---|---|---|---|
| Previous Owner | Johnson Mary A | $78,570 | |
| Previous Owner | Eady Tyrone A | $91,698 |
Source: Public Records
Tax History Compared to Growth
Tax History
| Year | Tax Paid | Tax Assessment Tax Assessment Total Assessment is a certain percentage of the fair market value that is determined by local assessors to be the total taxable value of land and additions on the property. | Land | Improvement |
|---|---|---|---|---|
| 2024 | -- | $90,436 | $7,600 | $82,836 |
| 2023 | $1,905 | $82,688 | $7,600 | $75,088 |
| 2022 | $2,502 | $80,228 | $7,600 | $72,628 |
| 2021 | $1,775 | $49,894 | $7,600 | $42,294 |
| 2020 | $1,749 | $49,894 | $7,600 | $42,294 |
| 2019 | $1,848 | $49,894 | $7,600 | $42,294 |
| 2018 | $1,860 | $49,894 | $7,600 | $42,294 |
| 2017 | $1,884 | $49,894 | $7,600 | $42,294 |
| 2016 | $1,886 | $49,894 | $7,600 | $42,294 |
| 2015 | $1,898 | $49,894 | $7,600 | $42,294 |
| 2014 | $1,900 | $49,894 | $7,600 | $42,294 |
Source: Public Records
Map
Nearby Homes
- 1663 Pine Ridge Dr N
- 4149 Markwalter Rd
- 1675 Pine Ridge Dr N
- 1679 Pine Ridge Dr N
- 1686 Pine Ridge Dr N
- 1715 Pine Ridge Dr N
- 1723 Pine Ridge Dr N
- 1727 Pine Ridge Dr N
- 1018 Cedarview Cir
- 1671 Pine Ridge Dr N
- 1724 Pine Ridge Dr N
- 1660 Pine Ridge Dr N
- 1775 Brown Rd
- 1843 Brown Rd
- 4331 Big Dipper Cir
- 4065 Goshen Lake Dr S
- 4065 Old Waynesboro Rd
- 4018 Rio Pinar Dr
- 4047 Goshen Lake Dr S
- 4005 Rio Pinar Dr