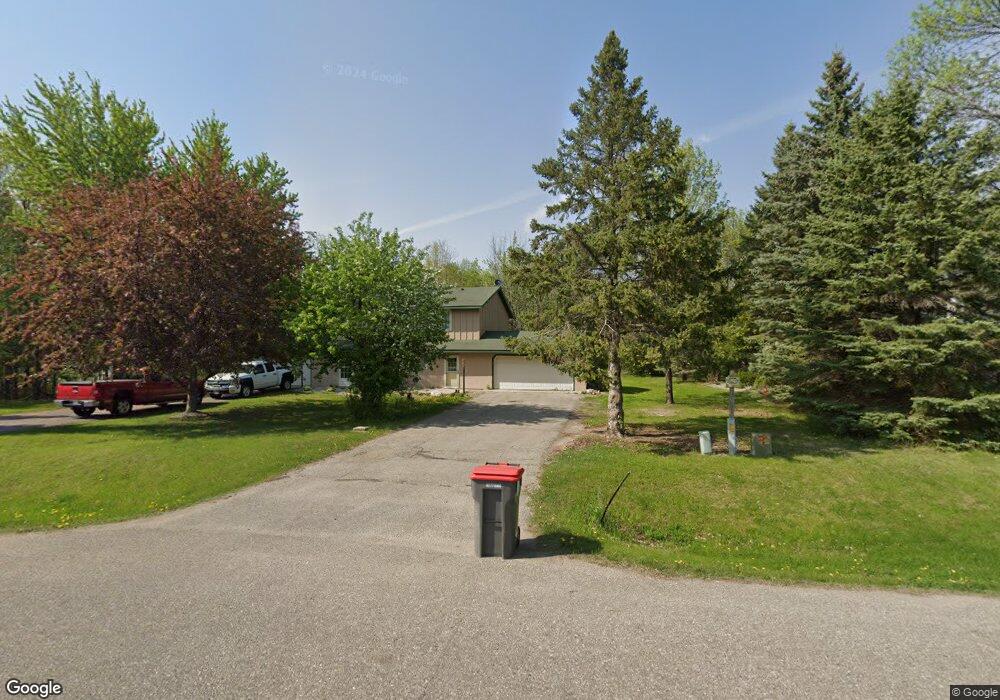
1709 S Oak Knoll Dr Unit NE Alexandria, MN 56308
Estimated Value: $182,000 - $251,000
2
Beds
1
Bath
576
Sq Ft
$368/Sq Ft
Est. Value
About This Home
This home is located at 1709 S Oak Knoll Dr Unit NE, Alexandria, MN 56308 and is currently estimated at $212,021, approximately $368 per square foot. 1709 S Oak Knoll Dr Unit NE is a home located in Douglas County with nearby schools including Voyager Elementary School, Discovery Middle School, and Alexandria Area High School.
Ownership History
Date
Name
Owned For
Owner Type
Purchase Details
Closed on
Jun 7, 2023
Sold by
Chyba Austin and Chyba Eliza
Bought by
Koep Cole
Current Estimated Value
Home Financials for this Owner
Home Financials are based on the most recent Mortgage that was taken out on this home.
Original Mortgage
$174,600
Outstanding Balance
$169,965
Interest Rate
6.43%
Mortgage Type
New Conventional
Estimated Equity
$42,056
Purchase Details
Closed on
Jun 5, 2020
Sold by
Hensley Amber L and Krienke Amber L
Bought by
Chyba Austin
Home Financials for this Owner
Home Financials are based on the most recent Mortgage that was taken out on this home.
Original Mortgage
$137,373
Interest Rate
3.3%
Mortgage Type
New Conventional
Purchase Details
Closed on
Jun 2, 2015
Sold by
Engstrom James E and Engstrom Darla M
Bought by
Krienke Amber L
Home Financials for this Owner
Home Financials are based on the most recent Mortgage that was taken out on this home.
Original Mortgage
$101,753
Interest Rate
3.64%
Mortgage Type
New Conventional
Create a Home Valuation Report for This Property
The Home Valuation Report is an in-depth analysis detailing your home's value as well as a comparison with similar homes in the area
Home Values in the Area
Average Home Value in this Area
Purchase History
| Date | Buyer | Sale Price | Title Company |
|---|---|---|---|
| Koep Cole | $180,000 | Integrity Title | |
| Chyba Austin | $136,000 | None Available | |
| Krienke Amber L | $104,900 | Integrity Title Inc |
Source: Public Records
Mortgage History
| Date | Status | Borrower | Loan Amount |
|---|---|---|---|
| Open | Koep Cole | $174,600 | |
| Previous Owner | Chyba Austin | $137,373 | |
| Previous Owner | Krienke Amber L | $101,753 |
Source: Public Records
Tax History Compared to Growth
Tax History
| Year | Tax Paid | Tax Assessment Tax Assessment Total Assessment is a certain percentage of the fair market value that is determined by local assessors to be the total taxable value of land and additions on the property. | Land | Improvement |
|---|---|---|---|---|
| 2025 | $1,808 | $176,200 | $28,300 | $147,900 |
| 2024 | $1,808 | $169,000 | $26,900 | $142,100 |
| 2023 | $1,638 | $143,600 | $26,900 | $116,700 |
| 2022 | $1,710 | $130,100 | $25,800 | $104,300 |
| 2021 | $1,370 | $133,600 | $25,800 | $107,800 |
| 2020 | $1,336 | $126,000 | $25,800 | $100,200 |
| 2019 | $1,160 | $120,800 | $25,800 | $95,000 |
| 2018 | $1,044 | $110,300 | $25,800 | $84,500 |
| 2017 | $966 | $105,000 | $25,800 | $79,200 |
| 2016 | $954 | $97,970 | $25,026 | $72,944 |
| 2015 | $922 | $0 | $0 | $0 |
| 2014 | -- | $92,500 | $24,500 | $68,000 |
Source: Public Records
Map
Nearby Homes
- 250 Rodeo Rd
- 820 N Mckay Ave NE
- XXX Mckay Ave N
- 1516 Will O B Ln NE
- 286 Rodeo Rd
- 1004 Thomas Dr NE
- 1024 Thomas Dr NE
- 217 Viking Place
- 215 N Mckay Ave Unit 59
- 1109 Lakeview Ave
- 2006 Lake Park Ave
- 112 Birch Ave
- 510 N Park St
- Blk 2 L 8 Geneva Rd NE
- Blk 1 L 6 Geneva Rd NE
- Blk 1 L 10 Geneva Rd NE
- Blk 1 L 4 Geneva Rd NE
- Blk 1 L 3 Geneva Rd NE
- Blk 1 L 8 Geneva Rd NE
- Blk 2 L 4 Geneva Rd NE
- 1711 S Oak Knoll Dr Unit NE
- 1709 S Oak Knoll Dr NE
- Lt 1,Blk 3 S Oak Knoll
- 1711 S Oak Knoll Dr NE Unit 1711 S Oak Knoll Dr
- 1711 S Oak Knoll Dr NE
- 1713 S Oak Knoll Dr Unit NE
- 1715 S Oak Knoll Dr Unit NE
- 609 N Mckay Ave NE
- 609 N Mckay Ave NE
- 609 N Mckay Ave NE
- 609 N Mckay Ave NE
- 1717 S Oak Knoll Dr
- 1717 S Oak Knoll Dr Unit NE
- 1717 1717 Oak Knoll Dr NE
- 1717 1717 Oak Knoll-Drive-ne
- 1717 S Oak Knoll Dr NE
- 609 N Mc Kay Ave NE
- 617 N Mckay Ave NE
- 509 N Mc Kay Ave NE
- 509 Mckay Ave N