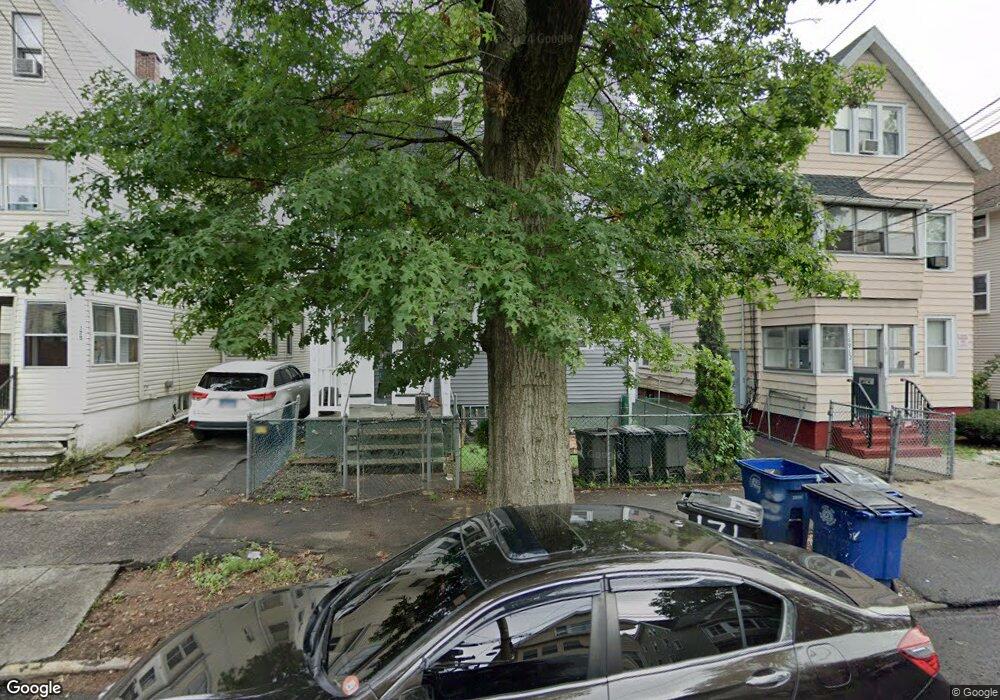
171 Chatham St New Haven, CT 06513
Fair Haven NeighborhoodEstimated Value: $316,000 - $474,000
3
Beds
2
Baths
1,086
Sq Ft
$366/Sq Ft
Est. Value
About This Home
This home is located at 171 Chatham St, New Haven, CT 06513 and is currently estimated at $397,000, approximately $365 per square foot. 171 Chatham St is a home located in New Haven County with nearby schools including Clinton Avenue School, Elm City College Preparatory School, and St Francis & St Rose Of Lima School.
Ownership History
Date
Name
Owned For
Owner Type
Purchase Details
Closed on
Sep 4, 2023
Sold by
Reichman Brodie Real Est
Bought by
Farren Moishe Llc
Current Estimated Value
Purchase Details
Closed on
Jun 11, 2021
Sold by
Lewis Wanda D
Bought by
Reichman Brodie Re Llc
Home Financials for this Owner
Home Financials are based on the most recent Mortgage that was taken out on this home.
Original Mortgage
$228,550
Interest Rate
2.9%
Mortgage Type
Purchase Money Mortgage
Purchase Details
Closed on
Oct 13, 1994
Sold by
New Haven Nbrhd Dev
Bought by
Lewis Wanda D
Home Financials for this Owner
Home Financials are based on the most recent Mortgage that was taken out on this home.
Original Mortgage
$100,000
Interest Rate
8.43%
Mortgage Type
Purchase Money Mortgage
Create a Home Valuation Report for This Property
The Home Valuation Report is an in-depth analysis detailing your home's value as well as a comparison with similar homes in the area
Home Values in the Area
Average Home Value in this Area
Purchase History
| Date | Buyer | Sale Price | Title Company |
|---|---|---|---|
| Farren Moishe Llc | -- | None Available | |
| Farren Moishe Llc | -- | None Available | |
| Reichman Brodie Re Llc | $200,000 | None Available | |
| Reichman Brodie Re Llc | $200,000 | None Available | |
| Lewis Wanda D | $125,000 | -- | |
| Lewis Wanda D | $125,000 | -- |
Source: Public Records
Mortgage History
| Date | Status | Borrower | Loan Amount |
|---|---|---|---|
| Previous Owner | Reichman Brodie Re Llc | $228,550 | |
| Previous Owner | Lewis Wanda D | $37,000 | |
| Previous Owner | Lewis Wanda D | $100,000 | |
| Closed | Lewis Wanda D | $18,750 |
Source: Public Records
Tax History Compared to Growth
Tax History
| Year | Tax Paid | Tax Assessment Tax Assessment Total Assessment is a certain percentage of the fair market value that is determined by local assessors to be the total taxable value of land and additions on the property. | Land | Improvement |
|---|---|---|---|---|
| 2025 | $10,207 | $259,070 | $46,130 | $212,940 |
| 2024 | $9,974 | $259,070 | $46,130 | $212,940 |
| 2023 | $5,541 | $148,957 | $46,130 | $102,827 |
| 2022 | $6,934 | $174,440 | $46,130 | $128,310 |
| 2021 | $4,626 | $105,420 | $32,480 | $72,940 |
| 2020 | $4,626 | $105,420 | $32,480 | $72,940 |
| 2019 | $4,531 | $105,420 | $32,480 | $72,940 |
| 2018 | $4,531 | $105,420 | $32,480 | $72,940 |
| 2017 | $4,078 | $105,420 | $32,480 | $72,940 |
| 2016 | $3,729 | $89,740 | $28,070 | $61,670 |
| 2015 | $3,729 | $89,740 | $28,070 | $61,670 |
| 2014 | $3,729 | $89,740 | $28,070 | $61,670 |
Source: Public Records
Map
Nearby Homes
- 169 Chatham St
- 175 Chatham St
- 167 Chatham St
- 179 Chatham St
- 179 Chatham St Unit 1
- 183 Chatham St
- 163 Chatham St
- 163 Chatham St Unit 2
- 163 Chatham St Unit 3
- 159 Chatham St
- 187 Chatham St
- 260 Lombard St
- 156 Atwater St
- 156 Atwater St
- 69 Rowe St
- 256 Lombard St
- 264 Lombard St
- 186 Chatham St Unit 2
- 268 Lombard St
- 252 Lombard St