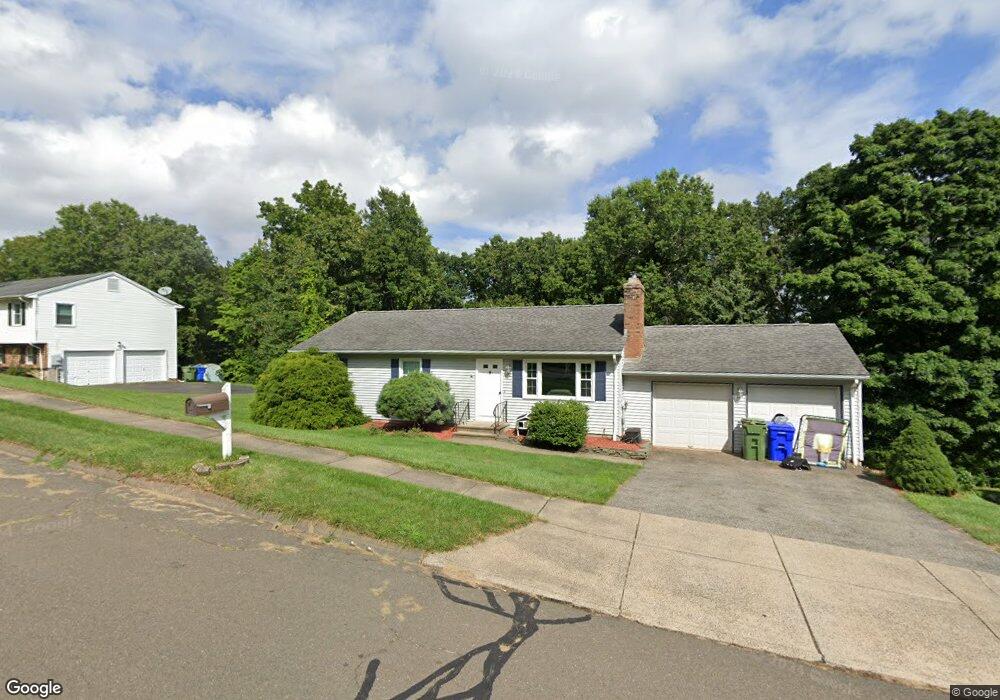
171 Cimarron Rd Middletown, CT 06457
Westfield NeighborhoodEstimated Value: $336,627 - $430,000
3
Beds
2
Baths
1,144
Sq Ft
$331/Sq Ft
Est. Value
About This Home
This home is located at 171 Cimarron Rd, Middletown, CT 06457 and is currently estimated at $378,407, approximately $330 per square foot. 171 Cimarron Rd is a home located in Middlesex County with nearby schools including Moody School, Middletown High School, and St John Paul II School.
Ownership History
Date
Name
Owned For
Owner Type
Purchase Details
Closed on
Jul 7, 2008
Sold by
Kelly Nancy D
Bought by
Peitier Sarah M and Gonzalez Jason M
Current Estimated Value
Home Financials for this Owner
Home Financials are based on the most recent Mortgage that was taken out on this home.
Original Mortgage
$213,300
Outstanding Balance
$134,191
Interest Rate
6.01%
Mortgage Type
Purchase Money Mortgage
Estimated Equity
$244,216
Purchase Details
Closed on
Oct 1, 2002
Sold by
Wnek Veronica C
Bought by
Kelly Nancy D
Home Financials for this Owner
Home Financials are based on the most recent Mortgage that was taken out on this home.
Original Mortgage
$110,000
Interest Rate
5.38%
Mortgage Type
Purchase Money Mortgage
Purchase Details
Closed on
Jun 2, 1993
Sold by
Wnek Raymond L
Bought by
Wnek Veronica C
Home Financials for this Owner
Home Financials are based on the most recent Mortgage that was taken out on this home.
Original Mortgage
$97,500
Interest Rate
4.25%
Mortgage Type
Purchase Money Mortgage
Create a Home Valuation Report for This Property
The Home Valuation Report is an in-depth analysis detailing your home's value as well as a comparison with similar homes in the area
Home Values in the Area
Average Home Value in this Area
Purchase History
| Date | Buyer | Sale Price | Title Company |
|---|---|---|---|
| Peitier Sarah M | $215,000 | -- | |
| Kelly Nancy D | $199,900 | -- | |
| Wnek Veronica C | $45,000 | -- |
Source: Public Records
Mortgage History
| Date | Status | Borrower | Loan Amount |
|---|---|---|---|
| Open | Wnek Veronica C | $213,300 | |
| Previous Owner | Wnek Veronica C | $110,000 | |
| Previous Owner | Wnek Veronica C | $96,000 | |
| Previous Owner | Wnek Veronica C | $97,500 |
Source: Public Records
Tax History
| Year | Tax Paid | Tax Assessment Tax Assessment Total Assessment is a certain percentage of the fair market value that is determined by local assessors to be the total taxable value of land and additions on the property. | Land | Improvement |
|---|---|---|---|---|
| 2025 | $6,102 | $181,150 | $65,420 | $115,730 |
| 2024 | $5,786 | $181,150 | $65,420 | $115,730 |
| 2023 | $5,442 | $181,150 | $65,420 | $115,730 |
| 2022 | $4,838 | $128,950 | $43,610 | $85,340 |
| 2021 | $4,826 | $128,950 | $43,610 | $85,340 |
| 2020 | $4,833 | $128,950 | $43,610 | $85,340 |
| 2019 | $4,859 | $128,950 | $43,610 | $85,340 |
| 2018 | $4,687 | $128,950 | $43,610 | $85,340 |
| 2017 | $4,643 | $130,960 | $47,320 | $83,640 |
| 2016 | $4,553 | $130,960 | $47,320 | $83,640 |
| 2015 | $4,455 | $130,960 | $47,320 | $83,640 |
| 2014 | $4,456 | $130,960 | $47,320 | $83,640 |
Source: Public Records
Map
Nearby Homes
- 270 Higby Rd
- 153 Country Club Rd
- 602 Higby Rd
- 3 Sisk St
- 5 Lorraine Terrace
- 60 Sonoma Ln
- 0 Country Club Rd and Massa Tom Rd Rd E
- 40 Sylvan Ridge
- 194 Camp St
- 473 Westfield St
- 128 Webster Ln
- 137 Webster Ln Unit 2-42
- 123 Webster Ln
- 145 Webster Ln Unit 2-41
- 82 Westfield Terrace
- 211 Boston Rd
- 160 Boston Rd
- 5 Nathan Hale Rd
- 1 Nathan Hale Rd
- 4 Nathan Hale Rd
- 181 Cimarron Rd
- 161 Cimarron Rd
- 155 Knox Blvd
- 151 Cimarron Rd
- 193 Cimarron Rd
- 145 Knox Blvd
- 188 Cimarron Rd
- 167 Knox Blvd
- 135 Knox Blvd
- 180 Cimarron Rd
- 170 Cimarron Rd
- 198 Cimarron Rd
- 160 Cimarron Rd
- 141 Cimarron Rd
- 207 Cimarron Rd
- 121 Knox Blvd
- 208 Cimarron Rd
- 144 Cimarron Rd
- 105 Knox Blvd
- 131 Cimarron Rd
Your Personal Tour Guide
Ask me questions while you tour the home.