171 Emerald Bay Laguna Beach, CA 92651
Emerald Bay NeighborhoodEstimated Value: $8,676,000 - $71,423,344
5
Beds
12
Baths
11,425
Sq Ft
$3,505/Sq Ft
Est. Value
About This Home
This home is located at 171 Emerald Bay, Laguna Beach, CA 92651 and is currently estimated at $40,049,672, approximately $3,505 per square foot. 171 Emerald Bay is a home located in Orange County with nearby schools including El Morro Elementary School, Thurston Middle School, and Laguna Beach High School.
Ownership History
Date
Name
Owned For
Owner Type
Purchase Details
Closed on
Aug 25, 2014
Sold by
171 Emerald Bay Llc
Bought by
Naranja Holdings Llc
Current Estimated Value
Purchase Details
Closed on
Sep 14, 2010
Sold by
Welch Louis and Welch Michu
Bought by
171 Emerald Bay Llc
Purchase Details
Closed on
Aug 20, 2007
Sold by
Hayes Kevin J and Hayes Alice H
Bought by
Welch Louis and Welch Michu
Purchase Details
Closed on
Mar 16, 2005
Sold by
Buck Investments
Bought by
Hayes Kevin J and Hayes Alice H
Home Financials for this Owner
Home Financials are based on the most recent Mortgage that was taken out on this home.
Original Mortgage
$6,000,000
Interest Rate
2%
Mortgage Type
Negative Amortization
Purchase Details
Closed on
Dec 19, 1997
Sold by
Lindstrom Gregory P and Lindstrom Carol J
Bought by
Buck Gerald E and Buck Bente
Purchase Details
Closed on
Mar 15, 1995
Sold by
Lindstrom Gregory P and Lindstrom Carol J
Bought by
Lindstrom Gregory P and Lindstrom Carol J
Create a Home Valuation Report for This Property
The Home Valuation Report is an in-depth analysis detailing your home's value as well as a comparison with similar homes in the area
Home Values in the Area
Average Home Value in this Area
Purchase History
| Date | Buyer | Sale Price | Title Company |
|---|---|---|---|
| Naranja Holdings Llc | $35,500,000 | Chicago Title | |
| 171 Emerald Bay Llc | -- | None Available | |
| Welch Louis | -- | None Available | |
| Hayes Kevin J | -- | Southland Title Corporation | |
| Buck Investments | -- | -- | |
| Buck Gerald E | -- | Commonwealth Land Title Co | |
| Lindstrom Gregory P | -- | -- |
Source: Public Records
Mortgage History
| Date | Status | Borrower | Loan Amount |
|---|---|---|---|
| Previous Owner | Hayes Kevin J | $6,000,000 | |
| Closed | Hayes Kevin J | $2,000,000 |
Source: Public Records
Tax History Compared to Growth
Tax History
| Year | Tax Paid | Tax Assessment Tax Assessment Total Assessment is a certain percentage of the fair market value that is determined by local assessors to be the total taxable value of land and additions on the property. | Land | Improvement |
|---|---|---|---|---|
| 2025 | $424,906 | $42,665,694 | $36,053,794 | $6,611,900 |
| 2024 | $424,906 | $41,829,112 | $35,346,857 | $6,482,255 |
| 2023 | $415,168 | $41,008,934 | $34,653,782 | $6,355,152 |
| 2022 | $407,381 | $40,204,838 | $33,974,296 | $6,230,542 |
| 2021 | $399,578 | $39,416,508 | $33,308,133 | $6,108,375 |
| 2020 | $395,458 | $39,012,341 | $32,966,599 | $6,045,742 |
| 2019 | $388,676 | $38,247,394 | $32,320,195 | $5,927,199 |
| 2018 | $381,126 | $37,497,446 | $31,686,466 | $5,810,980 |
| 2017 | $373,660 | $36,762,202 | $31,065,162 | $5,697,040 |
| 2016 | $366,637 | $36,041,375 | $30,456,041 | $5,585,334 |
| 2015 | $361,218 | $35,500,000 | $29,998,562 | $5,501,438 |
| 2014 | $160,514 | $15,764,033 | $10,764,771 | $4,999,262 |
Source: Public Records
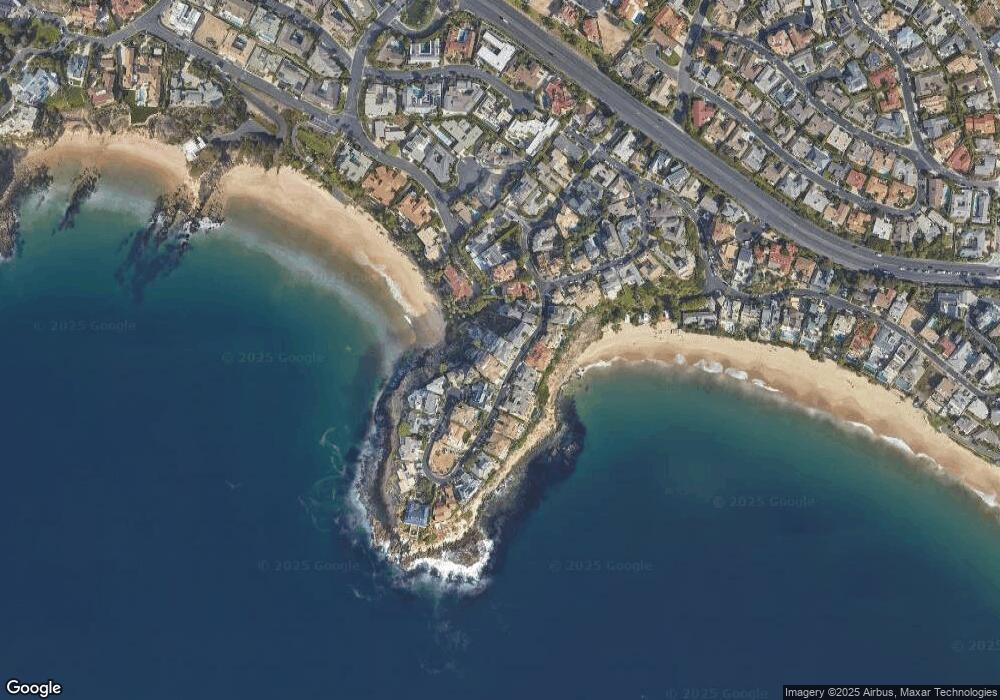
Map
Nearby Homes
- 199 Emerald Bay
- 145 Emerald Bay
- 138 Emerald Bay
- 2526 Riviera Dr
- 2538 Monaco Dr
- 70 Emerald Bay
- 74 Emerald Bay
- 140 Irvine Cove Cir
- 928 Emerald Bay
- 64 Emerald Bay
- 32 Emerald Bay
- 312 Emerald Bay
- 307 Emerald Bay
- 523 Emerald Bay
- 169 Mcknight Dr
- 1575 Via Capri Unit 6
- 159 Crescent Bay Dr
- 1565 N Coast Hwy Unit 5
- 245 Crescent Bay Dr
- 465 Panorama Dr
- 173 Emerald Bay
- 169 Emerald Bay
- 167 Emerald Bay
- 197 Emerald Bay
- 165 Emerald Bay
- 172 Emerald Bay
- 170 Emerald Bay
- 196 Emerald Bay
- 174 Emerald Bay
- 168 Emerald Bay
- 195 Emerald Bay
- 166 Emerald Bay
- 143 Emerald Bay
- 176 Emerald Bay
- 194 Emerald Bay
- 162 Emerald Bay
- 162 Emerald Bay
- 163 Emerald Bay
- 193 Emerald Bay