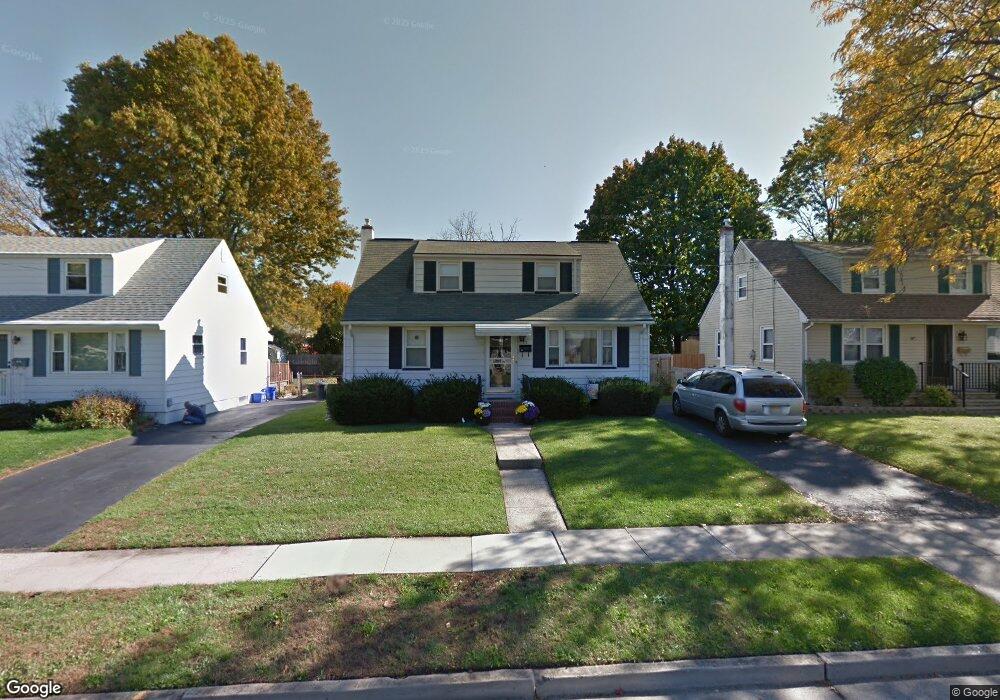
171 Exeter St Highland Park, NJ 08904
Estimated Value: $503,000 - $733,702
4
Beds
2
Baths
2,304
Sq Ft
$274/Sq Ft
Est. Value
About This Home
This home is located at 171 Exeter St, Highland Park, NJ 08904 and is currently estimated at $631,426, approximately $274 per square foot. 171 Exeter St is a home located in Middlesex County with nearby schools including Irving Primary School, Bartle School, and Highland Park Middle School.
Ownership History
Date
Name
Owned For
Owner Type
Purchase Details
Closed on
Nov 30, 2009
Sold by
Tumolo Samuel F and Tumolo Albert A
Bought by
Bardy Donna
Current Estimated Value
Home Financials for this Owner
Home Financials are based on the most recent Mortgage that was taken out on this home.
Original Mortgage
$115,000
Outstanding Balance
$75,432
Interest Rate
5.01%
Mortgage Type
New Conventional
Estimated Equity
$555,994
Purchase Details
Closed on
Dec 16, 2003
Sold by
Tumolo Albert A
Bought by
Tumolo Samuel F
Create a Home Valuation Report for This Property
The Home Valuation Report is an in-depth analysis detailing your home's value as well as a comparison with similar homes in the area
Home Values in the Area
Average Home Value in this Area
Purchase History
| Date | Buyer | Sale Price | Title Company |
|---|---|---|---|
| Bardy Donna | $295,000 | Fidelity Natl Title Ins Co | |
| Tumolo Samuel F | -- | -- |
Source: Public Records
Mortgage History
| Date | Status | Borrower | Loan Amount |
|---|---|---|---|
| Open | Bardy Donna | $115,000 |
Source: Public Records
Tax History Compared to Growth
Tax History
| Year | Tax Paid | Tax Assessment Tax Assessment Total Assessment is a certain percentage of the fair market value that is determined by local assessors to be the total taxable value of land and additions on the property. | Land | Improvement |
|---|---|---|---|---|
| 2025 | $14,580 | $569,100 | $194,000 | $375,100 |
| 2024 | $14,216 | $569,100 | $194,000 | $375,100 |
| 2023 | $14,216 | $569,100 | $194,000 | $375,100 |
| 2022 | $13,611 | $159,700 | $52,400 | $107,300 |
| 2021 | $6,715 | $159,700 | $52,400 | $107,300 |
| 2020 | $13,429 | $159,700 | $52,400 | $107,300 |
| 2019 | $8,070 | $95,900 | $52,400 | $43,500 |
| 2018 | $7,840 | $95,900 | $52,400 | $43,500 |
| 2017 | $7,534 | $95,900 | $52,400 | $43,500 |
| 2016 | $7,574 | $95,900 | $52,400 | $43,500 |
| 2015 | $7,290 | $95,900 | $52,400 | $43,500 |
| 2014 | $7,171 | $95,900 | $52,400 | $43,500 |
Source: Public Records
Map
Nearby Homes
- 56 Orange St
- 346 N Riverview Ave
- 111 Barnard St
- 152 Orange St
- 1144 Raritan Ave
- 14 York Dr Unit 4B
- 36 Brookhill Ave
- 31 York Dr Unit 3A
- 15 York Dr Unit 2A
- 15 York Dr Unit 1B
- 61 Duley Ave
- 37 York Dr Unit 6A
- 60 Fox Rd
- 66 Fox Rd Unit 9B
- 116 S 8th Ave
- 88 Fox Rd Unit 4B
- 10 N 8th Ave
- 45 Loring Ave
- 37 N 7th Ave
- 15 Bradley Dr