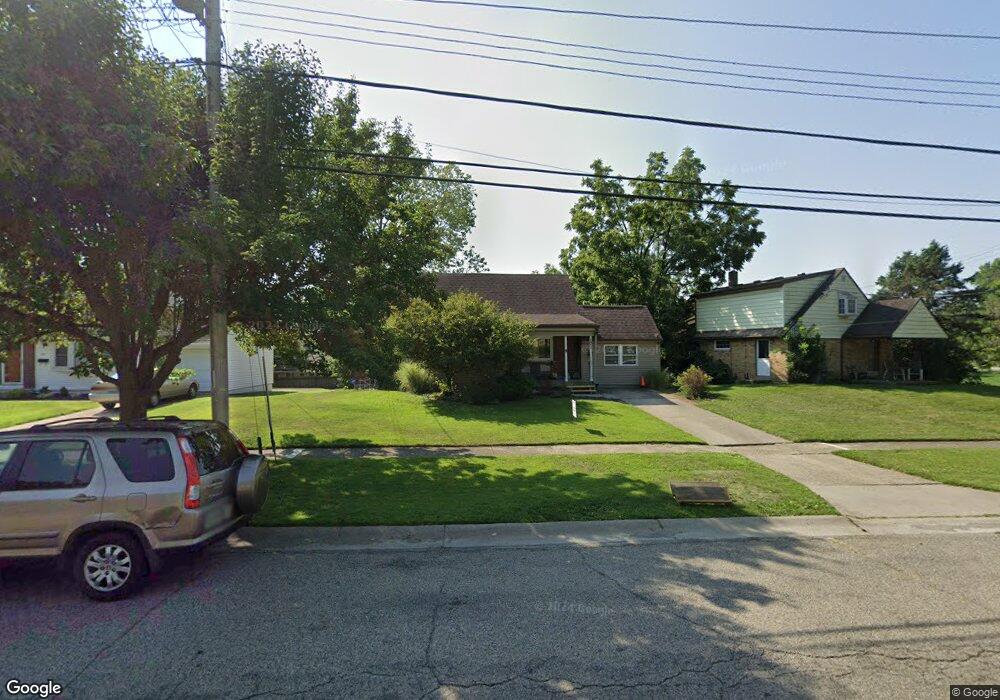
171 Farragut Rd Cincinnati, OH 45218
Estimated Value: $247,000 - $275,000
4
Beds
1
Bath
1,879
Sq Ft
$139/Sq Ft
Est. Value
About This Home
This home is located at 171 Farragut Rd, Cincinnati, OH 45218 and is currently estimated at $261,954, approximately $139 per square foot. 171 Farragut Rd is a home located in Hamilton County with nearby schools including Central Montessori Academy and John Paul II Catholic School.
Ownership History
Date
Name
Owned For
Owner Type
Purchase Details
Closed on
Dec 16, 1998
Sold by
Otten Wilma C and Otten Catherine Wilma
Bought by
Otten James Gary and Otten Kristi L Wulf
Current Estimated Value
Home Financials for this Owner
Home Financials are based on the most recent Mortgage that was taken out on this home.
Original Mortgage
$65,000
Outstanding Balance
$14,409
Interest Rate
6.5%
Estimated Equity
$247,545
Create a Home Valuation Report for This Property
The Home Valuation Report is an in-depth analysis detailing your home's value as well as a comparison with similar homes in the area
Home Values in the Area
Average Home Value in this Area
Purchase History
| Date | Buyer | Sale Price | Title Company |
|---|---|---|---|
| Otten James Gary | $81,300 | Tri-Star Title Agency Inc |
Source: Public Records
Mortgage History
| Date | Status | Borrower | Loan Amount |
|---|---|---|---|
| Open | Otten James Gary | $65,000 |
Source: Public Records
Tax History Compared to Growth
Tax History
| Year | Tax Paid | Tax Assessment Tax Assessment Total Assessment is a certain percentage of the fair market value that is determined by local assessors to be the total taxable value of land and additions on the property. | Land | Improvement |
|---|---|---|---|---|
| 2024 | $4,583 | $68,558 | $10,969 | $57,589 |
| 2023 | $4,271 | $68,558 | $10,969 | $57,589 |
| 2022 | $3,870 | $46,351 | $8,512 | $37,839 |
| 2021 | $3,791 | $44,916 | $8,512 | $36,404 |
| 2020 | $3,728 | $44,916 | $8,512 | $36,404 |
| 2019 | $3,626 | $38,392 | $7,277 | $31,115 |
| 2018 | $3,634 | $38,392 | $7,277 | $31,115 |
| 2017 | $3,369 | $38,392 | $7,277 | $31,115 |
| 2016 | $3,460 | $38,557 | $7,865 | $30,692 |
| 2015 | $3,251 | $38,557 | $7,865 | $30,692 |
| 2014 | $3,327 | $38,557 | $7,865 | $30,692 |
| 2013 | $3,514 | $41,909 | $8,547 | $33,362 |
Source: Public Records
Map
Nearby Homes