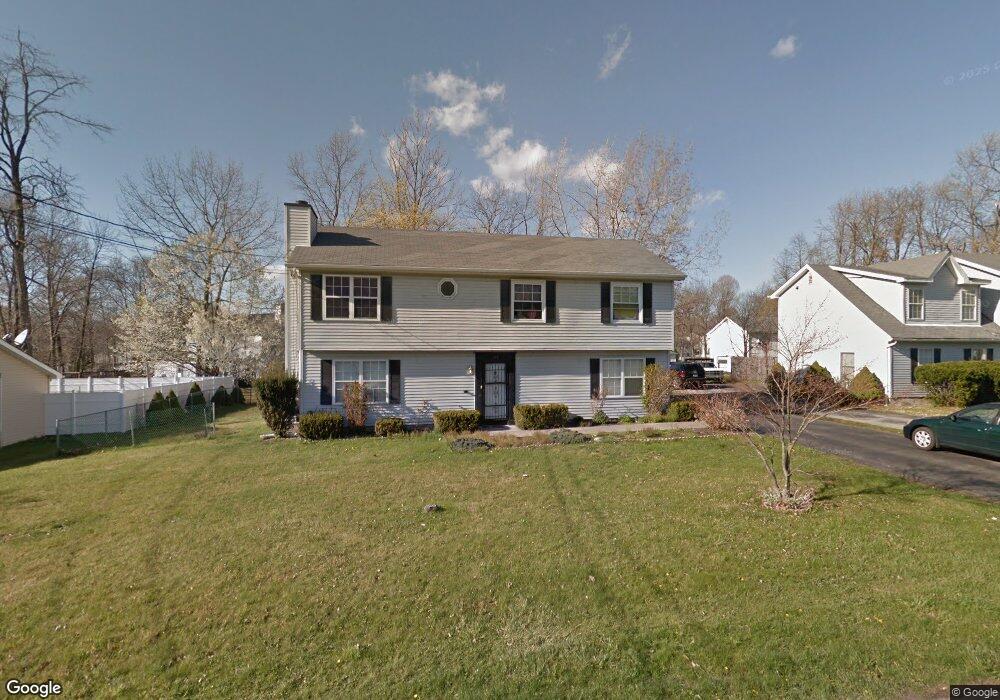
171 Fulton St Poughkeepsie, NY 12601
Estimated Value: $436,000 - $558,000
5
Beds
3
Baths
1,144
Sq Ft
$418/Sq Ft
Est. Value
About This Home
This home is located at 171 Fulton St, Poughkeepsie, NY 12601 and is currently estimated at $478,644, approximately $418 per square foot. 171 Fulton St is a home located in Dutchess County with nearby schools including Franklin D Roosevelt Senior High School and Faith Christian Academy.
Ownership History
Date
Name
Owned For
Owner Type
Purchase Details
Closed on
Jul 26, 2016
Sold by
Magamas Simon
Bought by
171 Fulton Inc
Current Estimated Value
Purchase Details
Closed on
Jul 1, 2016
Sold by
Bradford Construction Llc
Bought by
Magamas Simon
Purchase Details
Closed on
Apr 7, 2008
Sold by
Mcarthur Barun N
Bought by
Bradford Construction Llc
Purchase Details
Closed on
May 15, 2002
Sold by
Khalil Hani and Khalil Samar
Bought by
Mcarthur Barun
Purchase Details
Closed on
Apr 30, 1998
Sold by
Campbell Ralph V
Bought by
Khalil Hani and Khalil Samar
Create a Home Valuation Report for This Property
The Home Valuation Report is an in-depth analysis detailing your home's value as well as a comparison with similar homes in the area
Home Values in the Area
Average Home Value in this Area
Purchase History
| Date | Buyer | Sale Price | Title Company |
|---|---|---|---|
| 171 Fulton Inc | -- | -- | |
| Magamas Simon | $215,000 | David Sears | |
| Magamas Simon | $215,000 | David Sears | |
| Bradford Construction Llc | $270,000 | Michael Blustein | |
| Bradford Construction Llc | $270,000 | Michael Blustein | |
| Mcarthur Barun | $195,000 | Kenneth Stenger | |
| Mcarthur Barun | $195,000 | Kenneth Stenger | |
| Khalil Hani | $105,000 | -- | |
| Khalil Hani | $105,000 | -- |
Source: Public Records
Tax History Compared to Growth
Tax History
| Year | Tax Paid | Tax Assessment Tax Assessment Total Assessment is a certain percentage of the fair market value that is determined by local assessors to be the total taxable value of land and additions on the property. | Land | Improvement |
|---|---|---|---|---|
| 2024 | $11,699 | $340,000 | $49,900 | $290,100 |
| 2023 | $13,056 | $340,000 | $49,900 | $290,100 |
| 2022 | $11,601 | $306,000 | $45,300 | $260,700 |
| 2021 | $10,698 | $232,500 | $45,300 | $187,200 |
| 2020 | $8,559 | $217,000 | $45,300 | $171,700 |
| 2019 | $8,633 | $217,000 | $45,300 | $171,700 |
| 2018 | $8,769 | $217,000 | $45,300 | $171,700 |
| 2017 | $8,467 | $208,000 | $45,300 | $162,700 |
| 2016 | $8,061 | $180,000 | $45,300 | $134,700 |
| 2015 | -- | $205,000 | $52,000 | $153,000 |
| 2014 | -- | $239,000 | $52,000 | $187,000 |
Source: Public Records
Map
Nearby Homes