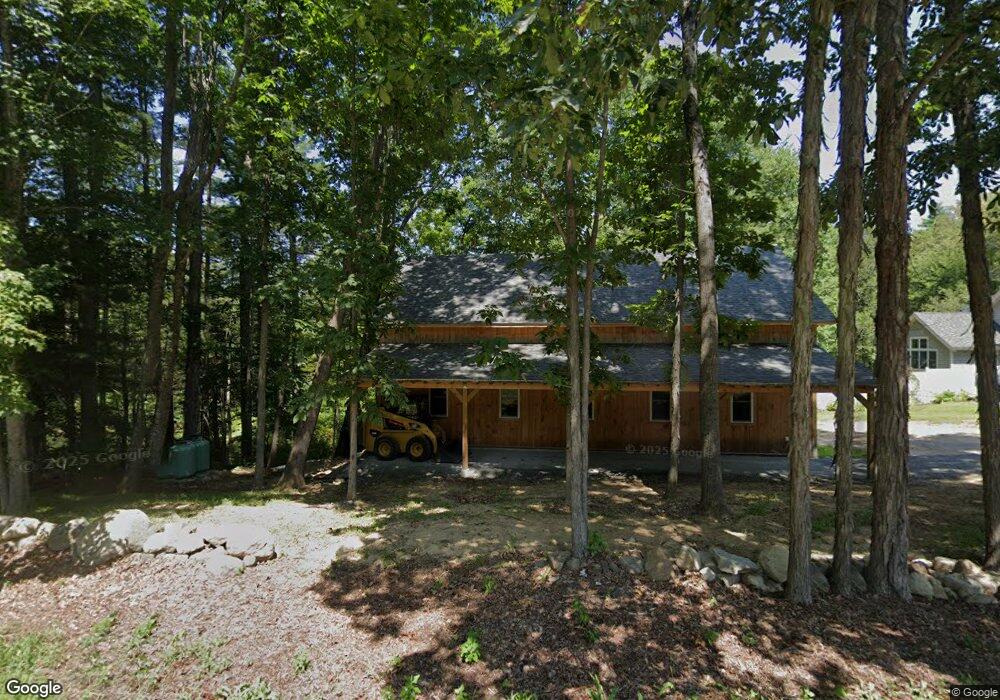
171 Main Ave South Hampton, NH 03827
Estimated Value: $630,000 - $1,512,000
3
Beds
2
Baths
5,431
Sq Ft
$186/Sq Ft
Est. Value
About This Home
This home is located at 171 Main Ave, South Hampton, NH 03827 and is currently estimated at $1,009,444, approximately $185 per square foot. 171 Main Ave is a home located in Rockingham County with nearby schools including South Hampton Barnard School, Winnacunnet High School, and Amesbury Seventh-Day Adventist School.
Ownership History
Date
Name
Owned For
Owner Type
Purchase Details
Closed on
Oct 10, 2006
Sold by
Kattar-Granata Heidi
Bought by
Cronin Isaiah D
Current Estimated Value
Home Financials for this Owner
Home Financials are based on the most recent Mortgage that was taken out on this home.
Original Mortgage
$311,000
Outstanding Balance
$186,399
Interest Rate
6.54%
Mortgage Type
Purchase Money Mortgage
Estimated Equity
$823,045
Create a Home Valuation Report for This Property
The Home Valuation Report is an in-depth analysis detailing your home's value as well as a comparison with similar homes in the area
Home Values in the Area
Average Home Value in this Area
Purchase History
| Date | Buyer | Sale Price | Title Company |
|---|---|---|---|
| Cronin Isaiah D | $297,000 | -- |
Source: Public Records
Mortgage History
| Date | Status | Borrower | Loan Amount |
|---|---|---|---|
| Open | Cronin Isaiah D | $311,000 |
Source: Public Records
Tax History Compared to Growth
Tax History
| Year | Tax Paid | Tax Assessment Tax Assessment Total Assessment is a certain percentage of the fair market value that is determined by local assessors to be the total taxable value of land and additions on the property. | Land | Improvement |
|---|---|---|---|---|
| 2024 | $12,963 | $939,340 | $276,940 | $662,400 |
| 2023 | $12,962 | $939,304 | $276,904 | $662,400 |
| 2022 | $8,522 | $429,122 | $152,322 | $276,800 |
| 2021 | $6,872 | $344,804 | $152,404 | $192,400 |
| 2020 | $6,832 | $365,383 | $152,383 | $213,000 |
| 2019 | $6,541 | $378,707 | $152,407 | $226,300 |
| 2018 | $6,312 | $378,668 | $152,368 | $226,300 |
| 2017 | $4,844 | $325,380 | $141,680 | $183,700 |
| 2016 | $5,840 | $325,380 | $141,680 | $183,700 |
| 2015 | $6,485 | $325,382 | $141,682 | $183,700 |
| 2014 | $6,085 | $325,385 | $141,685 | $183,700 |
| 2012 | $6,066 | $411,282 | $220,682 | $190,600 |
Source: Public Records
Map
Nearby Homes
- 43 Main Ave
- 10 Mason Ct Unit 10
- 28 Powderhouse Ct Unit 28
- 21 Currier St
- 1 Tuxbury Ln
- 4 Currier St
- 152 Kimball Rd
- 16 Glen Devin St
- 3 Glen Devin St
- 4 Woodsom Dr
- 25 Whittier Meadows Dr
- 2 Locke Hill Ln
- 2 Brookside Ln
- 155 Chase Rd
- 48 South Rd
- 7 Currierville Rd
- 1 Brown Ave Unit 3-78
- 1 Brown Ave Unit 3-80
- 3 Brown Ave Unit 75
- 43 Maple Ave