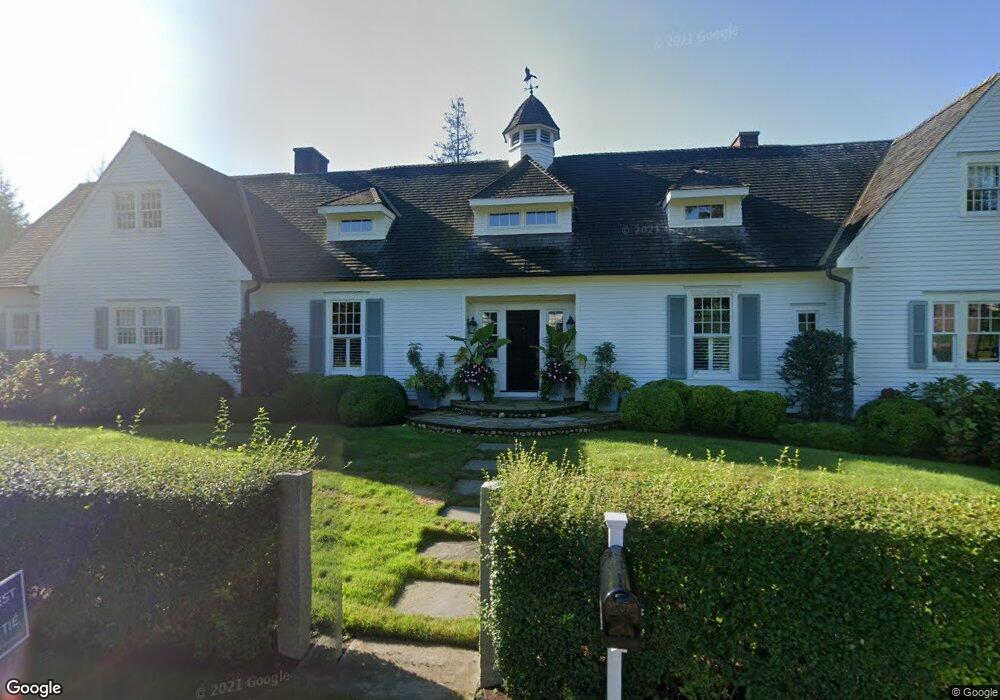
171 Pear Tree Point Rd Darien, CT 06820
Estimated Value: $5,691,130 - $6,941,000
5
Beds
6
Baths
6,305
Sq Ft
$997/Sq Ft
Est. Value
About This Home
This home is located at 171 Pear Tree Point Rd, Darien, CT 06820 and is currently estimated at $6,284,710, approximately $996 per square foot. 171 Pear Tree Point Rd is a home located in Fairfield County with nearby schools including Tokeneke Elementary School, Middlesex Middle School, and Darien High School.
Ownership History
Date
Name
Owned For
Owner Type
Purchase Details
Closed on
Apr 17, 2012
Sold by
Fine Jerrold and Fine Sally
Bought by
Fine Scott and Fine Kristin
Current Estimated Value
Purchase Details
Closed on
Jun 14, 2011
Sold by
Mayer Ft and Mayer William E
Bought by
Fine Jerrold
Purchase Details
Closed on
Jul 16, 2007
Sold by
Johnson Stephen and Johnson Ellis
Bought by
Moody Bernard William and Moody Barbara
Purchase Details
Closed on
Aug 3, 1999
Sold by
Home Frnt Renvatns Llc
Bought by
Johnson Stephen and Johnson Ellis
Purchase Details
Closed on
Sep 11, 1998
Sold by
Parsons Peartree Pt Nt and Parsons Thomas C
Bought by
Dupont Michael B
Create a Home Valuation Report for This Property
The Home Valuation Report is an in-depth analysis detailing your home's value as well as a comparison with similar homes in the area
Home Values in the Area
Average Home Value in this Area
Purchase History
| Date | Buyer | Sale Price | Title Company |
|---|---|---|---|
| Fine Scott | -- | -- | |
| Fine Jerold | -- | -- | |
| Fine Scott | -- | -- | |
| Fine Jerrold | -- | -- | |
| Moody Bernard William | $4,550,000 | -- | |
| Johnson Stephen | $2,004,300 | -- | |
| Dupont Michael B | $1,225,000 | -- |
Source: Public Records
Mortgage History
| Date | Status | Borrower | Loan Amount |
|---|---|---|---|
| Previous Owner | Dupont Michael B | $1,500,000 | |
| Previous Owner | Dupont Michael B | $2,500,000 |
Source: Public Records
Tax History Compared to Growth
Tax History
| Year | Tax Paid | Tax Assessment Tax Assessment Total Assessment is a certain percentage of the fair market value that is determined by local assessors to be the total taxable value of land and additions on the property. | Land | Improvement |
|---|---|---|---|---|
| 2025 | $54,777 | $3,538,570 | $1,960,000 | $1,578,570 |
| 2024 | $51,982 | $3,538,570 | $1,960,000 | $1,578,570 |
| 2023 | $46,284 | $2,628,290 | $1,400,000 | $1,228,290 |
| 2022 | $45,285 | $2,628,290 | $1,400,000 | $1,228,290 |
| 2021 | $8,642 | $2,628,290 | $1,400,000 | $1,228,290 |
| 2020 | $8,795 | $2,628,290 | $1,400,000 | $1,228,290 |
| 2019 | $43,288 | $2,628,290 | $1,400,000 | $1,228,290 |
| 2018 | $36,985 | $2,300,060 | $1,134,000 | $1,166,060 |
| 2017 | $8,713 | $2,229,430 | $1,134,000 | $1,095,430 |
| 2016 | $35,158 | $2,229,430 | $1,134,000 | $1,095,430 |
| 2015 | $34,222 | $2,229,430 | $1,134,000 | $1,095,430 |
| 2014 | $33,464 | $2,229,430 | $1,134,000 | $1,095,430 |
Source: Public Records
Map
Nearby Homes
- 74 Long Neck Point Rd
- 92 Pear Tree Point Rd
- 88 Pear Tree Point Rd
- 5 Mayflower Rd
- 5 Shipway Rd
- 28 Aquila Rd
- 53 Noroton Ave
- 33 Dora St
- 86 Wallacks Dr
- 55 Avery St
- 16 Neponsit St
- 120 Webb Ave
- 214 Seaside Ave
- 214 Seaside Ave Unit 2
- 209 Seaside Ave Unit 2
- 15 Robin St
- 105 Houston Terrace
- 175 Seaside Ave Unit 1
- 114 Sylvan Knoll Rd
- 737 Cove Rd Unit D2
- 170 Pear Tree Point Rd
- 159 Pear Tree Point Rd
- 166 Pear Tree Point Rd
- 180 Pear Tree Point Rd
- 158 Long Neck Point Rd
- 163 Pear Tree Point Rd
- 156 Pear Tree Point Rd
- 155 Pear Tree Point Rd
- 150 Pear Tree Point Rd
- 160 Long Neck Point Rd
- 140 Long Neck Point Rd
- 17 Crane Rd
- 18 Crane Rd
- 174 Long Neck Point Rd
- 172 Long Neck Point Rd
- 130 Long Neck Point Rd
- 147 Long Neck Point Rd
- 163 Long Neck Point Rd
- 136 Pear Tree Point Rd
- 15 Crane Rd