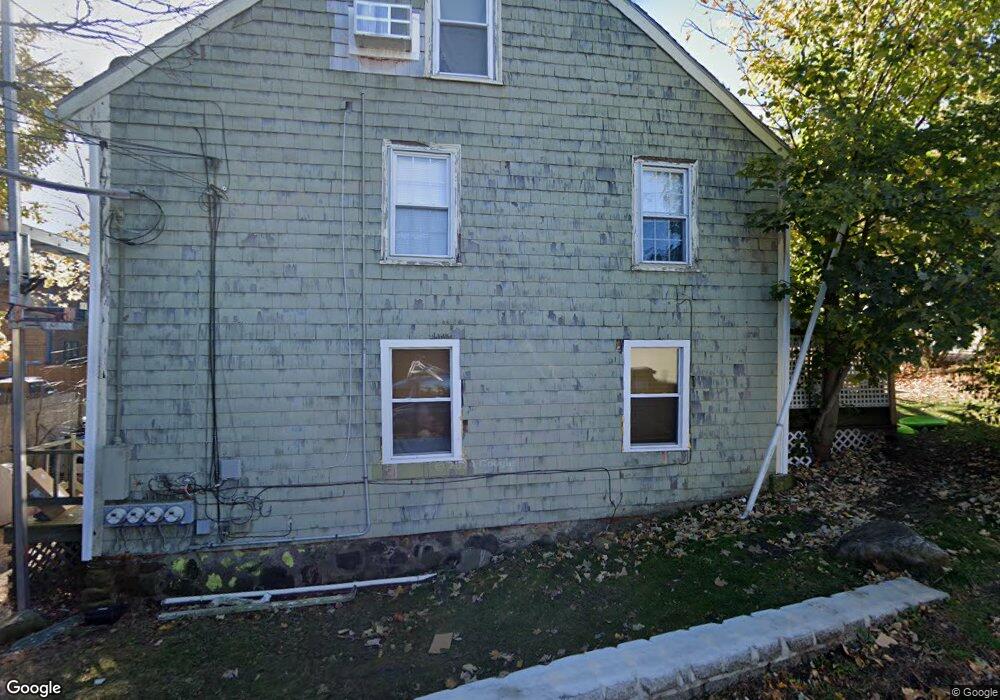
171 R Pleasant St Unit 2 Marblehead, MA 01945
Estimated Value: $317,000 - $459,000
2
Beds
1
Bath
815
Sq Ft
$481/Sq Ft
Est. Value
About This Home
This home is located at 171 R Pleasant St Unit 2, Marblehead, MA 01945 and is currently estimated at $391,927, approximately $480 per square foot. 171 R Pleasant St Unit 2 is a home located in Essex County with nearby schools including Marblehead High School, Marblehead Community Charter Public School, and Devereux School.
Ownership History
Date
Name
Owned For
Owner Type
Purchase Details
Closed on
Oct 23, 2018
Sold by
Christiana T Na
Bought by
Rem Initium Llc
Current Estimated Value
Purchase Details
Closed on
Oct 19, 2018
Sold by
Mcm Capital Parteners
Bought by
Wilmington Svgs Fund S
Purchase Details
Closed on
Jan 18, 2017
Sold by
Chapman Andrew
Bought by
Ventures T 2013 Ihr and Mcm Capital Ptnrs Llp
Purchase Details
Closed on
Oct 10, 2006
Sold by
Rosen Jonathan and Whalen Lori
Bought by
Chapman Andrew
Home Financials for this Owner
Home Financials are based on the most recent Mortgage that was taken out on this home.
Original Mortgage
$157,600
Interest Rate
6.54%
Mortgage Type
Purchase Money Mortgage
Purchase Details
Closed on
Aug 2, 1999
Sold by
Smith Roger K and Smith Marjorie G
Bought by
Rosen Jonathan and Gifford-Rosen Lori M
Purchase Details
Closed on
Aug 8, 1989
Sold by
Mccosker Melinda
Bought by
Smith Roger
Create a Home Valuation Report for This Property
The Home Valuation Report is an in-depth analysis detailing your home's value as well as a comparison with similar homes in the area
Home Values in the Area
Average Home Value in this Area
Purchase History
| Date | Buyer | Sale Price | Title Company |
|---|---|---|---|
| Rem Initium Llc | $195,000 | -- | |
| Wilmington Svgs Fund S | -- | -- | |
| Ventures T 2013 Ihr | $99,000 | -- | |
| Chapman Andrew | $197,000 | -- | |
| Rosen Jonathan | $133,000 | -- | |
| Smith Roger | $138,000 | -- |
Source: Public Records
Mortgage History
| Date | Status | Borrower | Loan Amount |
|---|---|---|---|
| Previous Owner | Smith Roger | $157,600 | |
| Previous Owner | Smith Roger | $29,550 | |
| Previous Owner | Smith Roger | $106,000 |
Source: Public Records
Tax History Compared to Growth
Tax History
| Year | Tax Paid | Tax Assessment Tax Assessment Total Assessment is a certain percentage of the fair market value that is determined by local assessors to be the total taxable value of land and additions on the property. | Land | Improvement |
|---|---|---|---|---|
| 2025 | $2,299 | $254,000 | $0 | $254,000 |
| 2024 | $2,305 | $257,200 | $0 | $257,200 |
| 2023 | $2,174 | $217,400 | $0 | $217,400 |
| 2022 | $2,191 | $208,300 | $0 | $208,300 |
| 2021 | $2,143 | $205,700 | $0 | $205,700 |
| 2020 | $2,053 | $197,600 | $0 | $197,600 |
| 2019 | $1,877 | $174,800 | $0 | $174,800 |
| 2018 | $2,270 | $206,000 | $0 | $206,000 |
| 2017 | $2,166 | $196,700 | $0 | $196,700 |
| 2016 | $1,995 | $179,700 | $0 | $179,700 |
| 2015 | $1,920 | $173,300 | $0 | $173,300 |
| 2014 | $1,844 | $166,300 | $0 | $166,300 |
Source: Public Records
Map
Nearby Homes
- 41 Rowland St
- 290 Washington St Unit 3
- 290 Washington St Unit 2
- 290 Washington St Unit 1
- 12 Heritage Way Unit 12
- 29 Village St Unit 1
- 41 Atlantic Ave Unit 1
- 2 Lindsey St
- 15 Lindsey St
- 60 Gregory St Unit 3
- 33 Waldron St
- 9 Skinner's Path Unit 9
- 134 Elm St
- 66 Jersey St
- 132 Elm St
- 132 Elm St Unit 132
- 25 Curtis St
- 70 Maverick St
- 45 Pleasant St
- 6 Higgins Rd
- 171R/175 Pleasant St
- 171R Pleasant St Unit 3
- 171R Pleasant St Unit 2
- 171R Pleasant St Unit 1
- 171R Pleasant St Unit 3 2
- 171R Pleasant St Unit 1 2
- 10 Bessom St Unit 5
- 171 Pleasant St Unit 2
- 171 Pleasant St
- 171 Pleasant St Unit rear
- 171 Pleasant St Unit 1
- 175 Pleasant St Unit 4
- 175 Pleasant St Unit 3
- 175 Pleasant St Unit 2
- 175 Pleasant St Unit 1
- 183 Pleasant St Unit 1
- 183 Pleasant St Unit 2
- 183 Pleasant St
- 185 Pleasant St Unit 1F
- 185 Pleasant St Unit 1