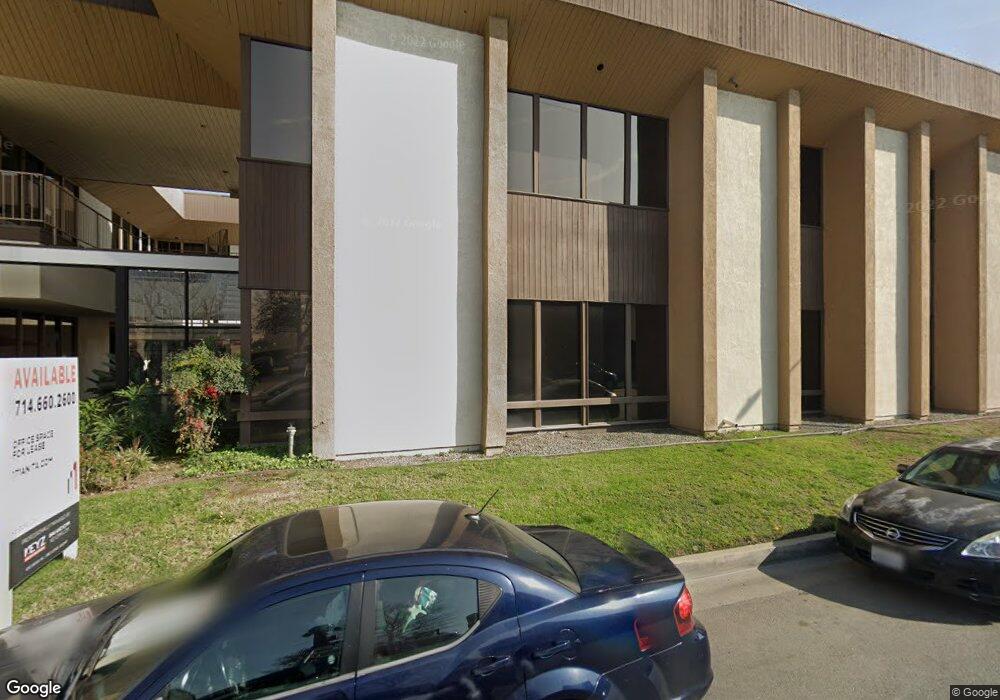
171 S Anita Dr Unit 100 Orange, CA 92868
Estimated Value: $6,194,756
--
Bed
--
Bath
21,948
Sq Ft
$282/Sq Ft
Est. Value
About This Home
This home is located at 171 S Anita Dr Unit 100, Orange, CA 92868 and is currently estimated at $6,194,756, approximately $282 per square foot. 171 S Anita Dr Unit 100 is a home located in Orange County with nearby schools including West Orange Elementary School, Portola Middle School, and Orange High School.
Ownership History
Date
Name
Owned For
Owner Type
Purchase Details
Closed on
Dec 24, 2019
Sold by
Fofo Lp
Bought by
Mosu Enterprise Llc
Current Estimated Value
Home Financials for this Owner
Home Financials are based on the most recent Mortgage that was taken out on this home.
Original Mortgage
$2,075,000
Outstanding Balance
$1,829,411
Interest Rate
3.6%
Mortgage Type
Commercial
Estimated Equity
$4,365,345
Purchase Details
Closed on
Dec 29, 2011
Sold by
Griffith William H and Griffith Jacqueline Wynn
Bought by
Fofo Lp
Home Financials for this Owner
Home Financials are based on the most recent Mortgage that was taken out on this home.
Original Mortgage
$2,500,000
Interest Rate
4.05%
Mortgage Type
Commercial
Purchase Details
Closed on
Dec 14, 2009
Sold by
Griffith William H
Bought by
Griffith William H and Truman Patricia
Purchase Details
Closed on
Mar 22, 2004
Sold by
Griffith William H
Bought by
Griffith William H and Griffith Jacqueline Wynn
Home Financials for this Owner
Home Financials are based on the most recent Mortgage that was taken out on this home.
Original Mortgage
$3,010,000
Interest Rate
5.99%
Mortgage Type
Commercial
Purchase Details
Closed on
Nov 15, 2002
Sold by
Apor Kevin E
Bought by
Apor Properties Llc
Home Financials for this Owner
Home Financials are based on the most recent Mortgage that was taken out on this home.
Original Mortgage
$2,240,000
Interest Rate
5.88%
Mortgage Type
Commercial
Purchase Details
Closed on
Oct 30, 2002
Sold by
Apor Rhonda G
Bought by
Apor Kevin E
Home Financials for this Owner
Home Financials are based on the most recent Mortgage that was taken out on this home.
Original Mortgage
$2,240,000
Interest Rate
5.88%
Mortgage Type
Commercial
Purchase Details
Closed on
Oct 1, 2002
Sold by
Jonatkim Enterprises
Bought by
Apor Kevin E
Home Financials for this Owner
Home Financials are based on the most recent Mortgage that was taken out on this home.
Original Mortgage
$2,240,000
Interest Rate
5.88%
Mortgage Type
Commercial
Purchase Details
Closed on
Jan 21, 1999
Sold by
J N K Investment Management
Bought by
Jonatkim Enterprises
Home Financials for this Owner
Home Financials are based on the most recent Mortgage that was taken out on this home.
Original Mortgage
$1,500,000
Interest Rate
6.77%
Mortgage Type
Commercial
Purchase Details
Closed on
Dec 3, 1993
Sold by
Edwards H Wayne and Edwards Darlene
Bought by
Wurth Larry M
Create a Home Valuation Report for This Property
The Home Valuation Report is an in-depth analysis detailing your home's value as well as a comparison with similar homes in the area
Home Values in the Area
Average Home Value in this Area
Purchase History
| Date | Buyer | Sale Price | Title Company |
|---|---|---|---|
| Mosu Enterprise Llc | $4,100,000 | Chicago Title Company | |
| Fofo Lp | -- | Chicago Title Company | |
| Griffith William H | -- | None Available | |
| Griffith William H | $4,300,000 | First American Title Company | |
| Apor Properties Llc | -- | -- | |
| Apor Kevin E | -- | Commerce Title Company | |
| Apor Kevin E | -- | Commerce Title Company | |
| Jonatkim Enterprises | -- | American Title | |
| Wurth Larry M | -- | United Title Company |
Source: Public Records
Mortgage History
| Date | Status | Borrower | Loan Amount |
|---|---|---|---|
| Open | Mosu Enterprise Llc | $2,075,000 | |
| Previous Owner | Fofo Lp | $2,500,000 | |
| Previous Owner | Griffith William H | $3,010,000 | |
| Previous Owner | Apor Kevin E | $2,240,000 | |
| Previous Owner | Jonatkim Enterprises | $1,500,000 |
Source: Public Records
Tax History Compared to Growth
Tax History
| Year | Tax Paid | Tax Assessment Tax Assessment Total Assessment is a certain percentage of the fair market value that is determined by local assessors to be the total taxable value of land and additions on the property. | Land | Improvement |
|---|---|---|---|---|
| 2025 | $49,864 | $4,483,947 | $2,952,845 | $1,531,102 |
| 2024 | $49,864 | $4,396,027 | $2,894,946 | $1,501,081 |
| 2023 | $48,753 | $4,309,831 | $2,838,182 | $1,471,649 |
| 2022 | $47,801 | $4,225,325 | $2,782,531 | $1,442,794 |
| 2021 | $46,480 | $4,142,476 | $2,727,972 | $1,414,504 |
| 2020 | $35,583 | $3,100,960 | $1,952,459 | $1,148,501 |
| 2019 | $35,150 | $3,040,157 | $1,914,175 | $1,125,982 |
| 2018 | $34,620 | $2,980,547 | $1,876,643 | $1,103,904 |
| 2017 | $33,219 | $2,922,105 | $1,839,846 | $1,082,259 |
| 2016 | $32,587 | $2,864,809 | $1,803,770 | $1,061,039 |
| 2015 | $32,113 | $2,821,777 | $1,776,675 | $1,045,102 |
| 2014 | $31,433 | $2,766,503 | $1,741,873 | $1,024,630 |
Source: Public Records
Map
Nearby Homes
- 246 N Donneybrooke St
- 272 N Donneybrooke St
- 2234 W Palm Ave
- 300 N Rampart St Unit 174
- 300 N Rampart St Unit 194
- 1915 W Almond Ave
- 2022 W Spruce Ave
- 1910 W Palmyra Ave Unit 138
- 1910 W Palmyra Ave Unit 94
- 262 S La Linda Dr
- 1938 W Culver Ave Unit 14
- 2244 W Beverly Dr
- 534 S Flower Cir
- 225 S Feldner Rd
- 1043 W Orange Rd
- 942 E Drapery Ln
- 1107 W Memory Ln Unit 17A
- 2300 S Lewis St Unit 172
- 2300 S Lewis St Unit 92
- 2300 S Lewis St Unit 20
- 171 S Anita Dr
- 171 S Anita Dr
- 171 S Anita Dr Unit 210
- 171 S Anita Dr Unit 116
- 171 S Anita Dr Unit 115
- 171 S Anita Dr Unit 120
- 171 S Anita Dr Unit 213
- 171 S Anita Dr Unit 200-C
- 171 S Anita Dr Unit 211
- 171 S Anita Dr Unit 114
- 171 S Anita Dr Unit 220
- 201 S Anita Dr Unit 201
- 201 S Anita Dr Unit 204
- 201 S Anita Dr Unit 203
- 201 S Anita Dr Unit 104
- 201 S Anita Dr
- 132 S Anita Dr
- 1545 1545 W Palmyra Unit 3
- 1323 #B W Palmyra
- 137 & 139 S Parker St