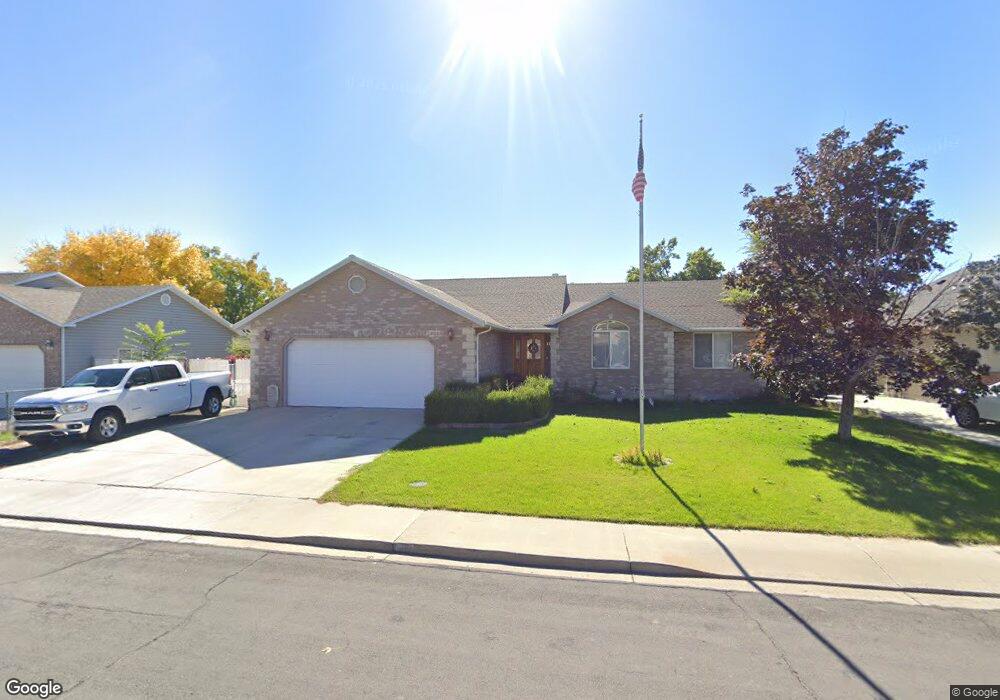
171 W 1435 S Orem, UT 84058
Lakeview NeighborhoodEstimated Value: $668,099 - $695,000
6
Beds
4
Baths
3,880
Sq Ft
$175/Sq Ft
Est. Value
About This Home
This home is located at 171 W 1435 S, Orem, UT 84058 and is currently estimated at $678,700, approximately $174 per square foot. 171 W 1435 S is a home located in Utah County with nearby schools including Cherry Hill Elementary School, Lakeridge Jr High School, and Mountain View High School.
Ownership History
Date
Name
Owned For
Owner Type
Purchase Details
Closed on
May 4, 2020
Sold by
Madsen Marilyn Klay
Bought by
Madsen Marilyn K and The Marilyn K Madsen Trust
Current Estimated Value
Purchase Details
Closed on
Dec 2, 2009
Sold by
Madsen Marilyn Kay
Bought by
Madsen Marilyn Kay and Madsen Dean Jay
Purchase Details
Closed on
Oct 18, 2005
Sold by
Paulsen Eugene H
Bought by
Barney Mont
Purchase Details
Closed on
Aug 9, 2005
Sold by
Paulsen Elaine Kaye
Bought by
Paulsen Ii Eugene H
Create a Home Valuation Report for This Property
The Home Valuation Report is an in-depth analysis detailing your home's value as well as a comparison with similar homes in the area
Home Values in the Area
Average Home Value in this Area
Purchase History
| Date | Buyer | Sale Price | Title Company |
|---|---|---|---|
| Madsen Marilyn K | -- | None Available | |
| Madsen Marilyn Kay | -- | Equity Title Insurance Agenc | |
| Barney Mont | $255,500 | -- | |
| Paulsen Ii Eugene H | -- | -- |
Source: Public Records
Tax History
| Year | Tax Paid | Tax Assessment Tax Assessment Total Assessment is a certain percentage of the fair market value that is determined by local assessors to be the total taxable value of land and additions on the property. | Land | Improvement |
|---|---|---|---|---|
| 2025 | $2,736 | $355,300 | -- | -- |
| 2024 | $2,736 | $334,565 | $0 | $0 |
| 2023 | $2,567 | $337,370 | $0 | $0 |
| 2022 | $2,463 | $313,555 | $0 | $0 |
| 2021 | $2,295 | $442,600 | $181,800 | $260,800 |
| 2020 | $2,116 | $401,100 | $145,400 | $255,700 |
| 2019 | $2,035 | $401,100 | $145,400 | $255,700 |
| 2018 | $1,986 | $374,000 | $127,700 | $246,300 |
| 2017 | $1,909 | $192,610 | $0 | $0 |
| 2016 | $1,935 | $180,015 | $0 | $0 |
| 2015 | $1,977 | $173,965 | $0 | $0 |
| 2014 | $1,951 | $170,830 | $0 | $0 |
Source: Public Records
Map
Nearby Homes
Your Personal Tour Guide
Ask me questions while you tour the home.