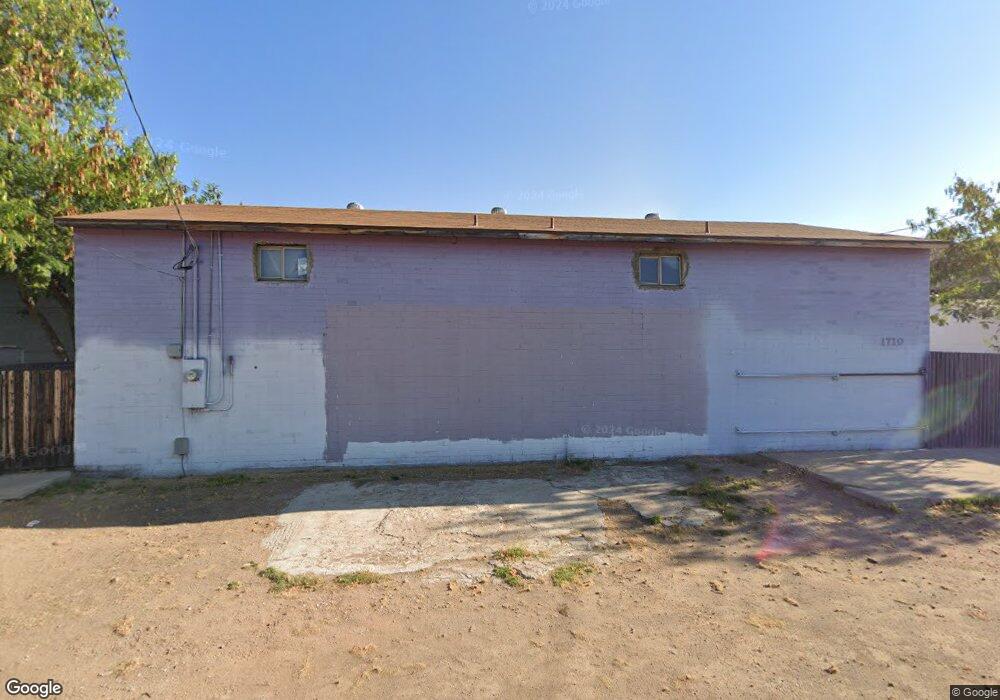
1710 E Cambridge Ave Phoenix, AZ 85006
Central City NeighborhoodEstimated Value: $115,058 - $428,000
Studio
--
Bath
2,200
Sq Ft
$123/Sq Ft
Est. Value
About This Home
This home is located at 1710 E Cambridge Ave, Phoenix, AZ 85006 and is currently estimated at $271,529, approximately $123 per square foot. 1710 E Cambridge Ave is a home located in Maricopa County with nearby schools including Loma Linda Elementary School, North High School, and Phoenix Coding Academy.
Ownership History
Date
Name
Owned For
Owner Type
Purchase Details
Closed on
Jan 21, 2008
Sold by
Marzullo Becky C and Rosso Becky C
Bought by
Baylis Clarinda L
Current Estimated Value
Purchase Details
Closed on
Apr 26, 2006
Sold by
Watson Michael P
Bought by
Calvano Charles T
Purchase Details
Closed on
Jun 16, 2005
Sold by
Bayles Clarinda L
Bought by
Broadus Carrie Bee and Bayles Clarinda L
Purchase Details
Closed on
Jan 21, 2005
Sold by
Marzullo Becky C and Russo Becky C
Bought by
Baylis Clarinda L
Home Financials for this Owner
Home Financials are based on the most recent Mortgage that was taken out on this home.
Original Mortgage
$30,000
Interest Rate
5.67%
Mortgage Type
Seller Take Back
Purchase Details
Closed on
Apr 24, 1995
Sold by
Russo Frank R
Bought by
Russo Becky C
Purchase Details
Closed on
Dec 19, 1994
Sold by
Russo Frank C
Bought by
Russo Becky C
Create a Home Valuation Report for This Property
The Home Valuation Report is an in-depth analysis detailing your home's value as well as a comparison with similar homes in the area
Home Values in the Area
Average Home Value in this Area
Purchase History
| Date | Buyer | Sale Price | Title Company |
|---|---|---|---|
| Baylis Clarinda L | $950,000 | Chicago Title Agency Inc | |
| Calvano Charles T | $815,000 | Transnation Title Ins Co | |
| Broadus Carrie Bee | -- | -- | |
| Baylis Clarinda L | -- | -- | |
| Baylis Clarinda L | $50,000 | Chicago Title Insurance Co | |
| Russo Becky C | -- | Old Republic Title Agency | |
| Russo Becky C | -- | -- |
Source: Public Records
Mortgage History
| Date | Status | Borrower | Loan Amount |
|---|---|---|---|
| Previous Owner | Baylis Clarinda L | $30,000 |
Source: Public Records
Tax History
| Year | Tax Paid | Tax Assessment Tax Assessment Total Assessment is a certain percentage of the fair market value that is determined by local assessors to be the total taxable value of land and additions on the property. | Land | Improvement |
|---|---|---|---|---|
| 2025 | $1,386 | $10,261 | -- | -- |
| 2024 | $1,319 | $9,772 | -- | -- |
| 2023 | $1,319 | $18,930 | $12,255 | $6,675 |
| 2022 | $1,267 | $14,700 | $8,715 | $5,985 |
| 2021 | $1,298 | $14,145 | $8,205 | $5,940 |
| 2020 | $1,266 | $14,490 | $8,535 | $5,955 |
| 2019 | $1,257 | $12,300 | $6,615 | $5,685 |
| 2018 | $1,231 | $12,510 | $6,615 | $5,895 |
| 2017 | $1,184 | $6,945 | $885 | $6,060 |
| 2016 | $1,181 | $7,095 | $885 | $6,210 |
Source: Public Records
Map
Nearby Homes
- 2811 N 17th Place
- 1747 E Virginia Ave
- 2701 N 16th St Unit 210
- 2701 N 16th St Unit 108
- 2701 N 16th St Unit 211
- 2533 N 16th St
- 1731 E Verde Ln
- 1630 E Harvard St
- 2545 N 15th St
- 2531 N 15th St
- 1516 E Thomas Rd
- 1923 E Yale St
- 1513 E Sheridan St
- 1904 E Harvard St
- 1950 E Yale St
- 1413 E Windsor Ave
- 1847 E Pinchot Ave
- 3023 N 16th St
- 2621 N 14th St
- 1637 E Earll Dr
- 1714 E Cambridge Ave
- 1702 E Cambridge Ave Unit 1-2
- 1702 E Cambridge Ave
- 1702 E Cambridge Ave Unit 2
- 1702 E Cambridge Ave Unit 1
- 1701 E Cambridge Ave
- 1701 E Cambridge Ave Unit 8
- 1731 E Cambridge Ave
- 1729 E Cambridge Ave
- 2808 N 17th Place
- 1649 E Cambridge Ave
- 1733 E Cambridge Ave
- 2801 N 17th Place
- 2812 N 17th Place Unit 4
- 2812 N 17th Place Unit 6
- 2812 N 17th Place Unit 5
- 2812 N 17th Place
- 1725 E Cambridge Ave Unit 205
- 1725 E Cambridge Ave
Your Personal Tour Guide
Ask me questions while you tour the home.