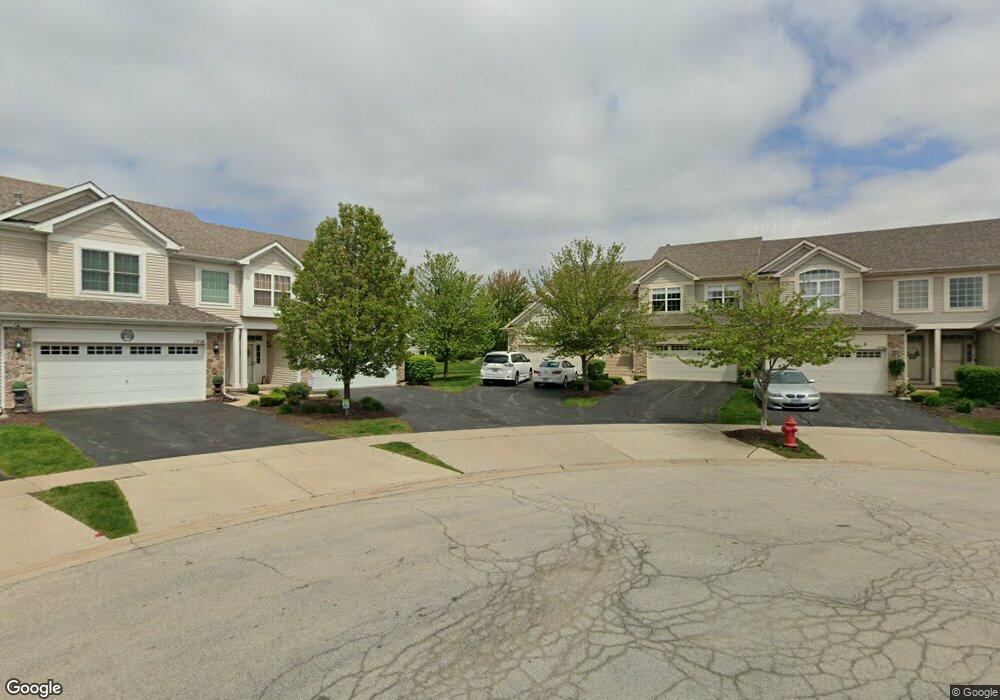
1710 Fieldstone Ct Unit 479 Shorewood, IL 60404
Estimated Value: $255,609 - $304,000
--
Bed
1
Bath
1,205
Sq Ft
$236/Sq Ft
Est. Value
About This Home
This home is located at 1710 Fieldstone Ct Unit 479, Shorewood, IL 60404 and is currently estimated at $284,402, approximately $236 per square foot. 1710 Fieldstone Ct Unit 479 is a home located in Will County with nearby schools including Walnut Trails Elementary School, Minooka Junior High School, and Minooka Intermediate School.
Ownership History
Date
Name
Owned For
Owner Type
Purchase Details
Closed on
Jan 4, 2008
Sold by
Brandolino Sabatino and Brandolino Carol A
Bought by
Zwirblis Cathy S
Current Estimated Value
Home Financials for this Owner
Home Financials are based on the most recent Mortgage that was taken out on this home.
Original Mortgage
$196,910
Outstanding Balance
$122,403
Interest Rate
5.87%
Mortgage Type
New Conventional
Estimated Equity
$161,999
Purchase Details
Closed on
Oct 4, 2006
Sold by
Brandolino Sabatino and Brandolino Carol A
Bought by
Brandolino Sabatino and Brandolino Carol A
Purchase Details
Closed on
Dec 14, 2005
Sold by
Kipling Townes Llc
Bought by
Brandolino Sabatino and Brandolino Carol A
Home Financials for this Owner
Home Financials are based on the most recent Mortgage that was taken out on this home.
Original Mortgage
$189,734
Interest Rate
6.48%
Mortgage Type
Fannie Mae Freddie Mac
Create a Home Valuation Report for This Property
The Home Valuation Report is an in-depth analysis detailing your home's value as well as a comparison with similar homes in the area
Home Values in the Area
Average Home Value in this Area
Purchase History
| Date | Buyer | Sale Price | Title Company |
|---|---|---|---|
| Zwirblis Cathy S | -- | Law Title Insurance | |
| Brandolino Sabatino | -- | Lawyers Title Ins Corp | |
| Brandolino Sabatino | $200,000 | Lawyers |
Source: Public Records
Mortgage History
| Date | Status | Borrower | Loan Amount |
|---|---|---|---|
| Open | Zwirblis Cathy S | $196,910 | |
| Closed | Brandolino Sabatino | $189,734 |
Source: Public Records
Tax History Compared to Growth
Tax History
| Year | Tax Paid | Tax Assessment Tax Assessment Total Assessment is a certain percentage of the fair market value that is determined by local assessors to be the total taxable value of land and additions on the property. | Land | Improvement |
|---|---|---|---|---|
| 2024 | $5,376 | $78,620 | $12,990 | $65,630 |
| 2023 | $5,376 | $70,638 | $11,671 | $58,967 |
| 2022 | $4,751 | $66,842 | $11,044 | $55,798 |
| 2021 | $4,460 | $62,880 | $10,389 | $52,491 |
| 2020 | $4,530 | $62,880 | $10,389 | $52,491 |
| 2019 | $4,432 | $60,316 | $9,965 | $50,351 |
| 2018 | $4,040 | $54,865 | $9,965 | $44,900 |
| 2017 | $3,771 | $50,990 | $9,965 | $41,025 |
| 2016 | $3,617 | $48,465 | $9,965 | $38,500 |
| 2015 | $3,139 | $47,735 | $8,835 | $38,900 |
| 2014 | $3,139 | $44,751 | $8,835 | $35,916 |
| 2013 | $3,139 | $44,751 | $8,835 | $35,916 |
Source: Public Records
Map
Nearby Homes
- 1632 Fieldstone Dr S Unit 2
- 1794 Fieldstone Dr N Unit 1794
- 1713 Fieldstone Dr N
- 1604 Augusta Ln
- 21037 Coventry Cir
- 25226 Balmoral Dr
- 25102 Old Oak Ln
- 1018 Butterfield Cir E Unit 5
- 21059 Somerset St
- 0000 W Seil Rd
- 760 Pleasant Dr
- 709 Flag Dr
- 704 Flag Dr
- 21340 Somerset St
- 636 Flag Dr
- 24951 W Lake Forrest Ln
- 21350 S Forest View Dr
- 21246 Woodland Way
- 621 Pleasant Dr
- 22020 S River Rd
- 1702 Fieldstone Ct Unit 483
- 1708 Fieldstone Ct Unit 480
- 1700 Fieldstone Ct Unit 484
- 1706 Fieldstone Ct Unit 481
- 1704 Fieldstone Ct Unit 482
- 1702 Fieldstone Ct
- 1712 Fieldstone Ct Unit 478
- 1716 Fieldstone Ct Unit 476
- 1718 Fieldstone Ct Unit 475
- 1714 Fieldstone Ct Unit 477
- 1714 Fieldstone Ct Unit 1714
- 1707 Fieldstone Ct Unit 488
- 1709 Fieldstone Ct Unit 489
- 1705 Fieldstone Ct Unit 487
- 1701 Fieldstone Ct Unit 485
- 1711 Fieldstone Ct Unit 490
- 1709 Fieldstone Ct Unit 5
- 1701 Fieldstone Ct Unit 48
- 1608 Fieldstone Dr S Unit 2