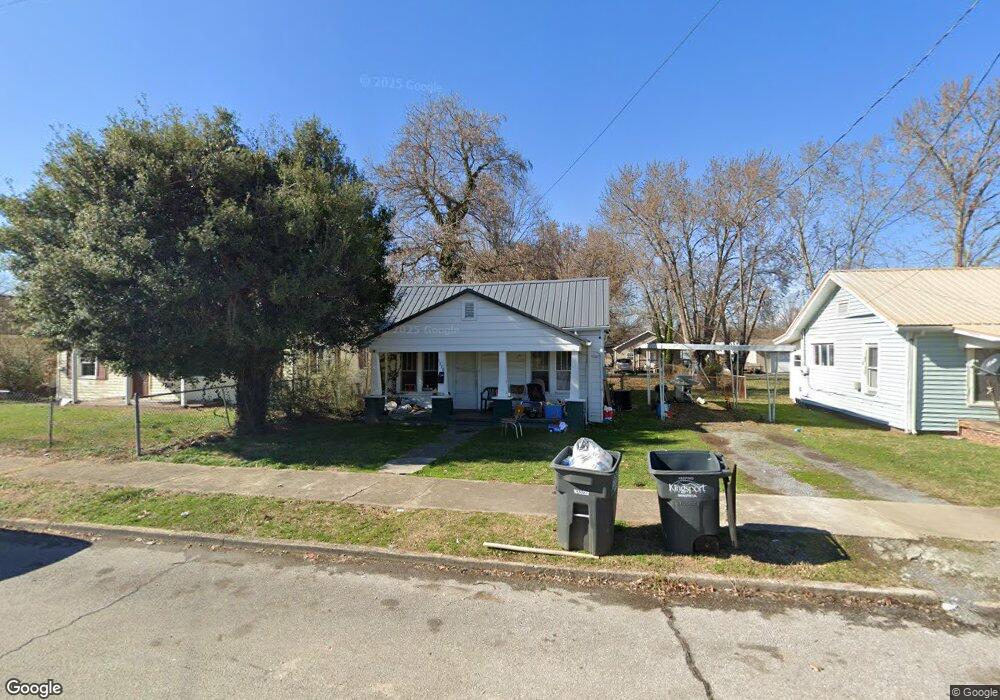
1710 Highland St Kingsport, TN 37664
Highland Park NeighborhoodEstimated Value: $110,766 - $167,000
--
Bed
1
Bath
1,080
Sq Ft
$134/Sq Ft
Est. Value
About This Home
This home is located at 1710 Highland St, Kingsport, TN 37664 and is currently estimated at $144,442, approximately $133 per square foot. 1710 Highland St is a home located in Sullivan County with nearby schools including Abraham Lincoln Elementary School, John Sevier Middle School, and Ross N. Robinson Middle School.
Ownership History
Date
Name
Owned For
Owner Type
Purchase Details
Closed on
Oct 4, 2022
Sold by
Evanridge Properties Llc
Bought by
Armstrong-Beatty Mosiah Vernon
Current Estimated Value
Home Financials for this Owner
Home Financials are based on the most recent Mortgage that was taken out on this home.
Original Mortgage
$64,608
Outstanding Balance
$62,004
Interest Rate
5.66%
Mortgage Type
FHA
Estimated Equity
$82,438
Purchase Details
Closed on
Feb 24, 2022
Sold by
Denton Hoyt H
Bought by
Evanridge Properties Llc
Purchase Details
Closed on
Oct 30, 2017
Sold by
Hhmm Family Limited Partnership and Denton Hoyt D
Bought by
Evanridge Properties Llc
Purchase Details
Closed on
May 1, 2006
Purchase Details
Closed on
Jan 4, 2000
Bought by
Denton Bradford H
Purchase Details
Closed on
Dec 19, 1997
Home Financials for this Owner
Home Financials are based on the most recent Mortgage that was taken out on this home.
Original Mortgage
$20,700
Interest Rate
6.76%
Create a Home Valuation Report for This Property
The Home Valuation Report is an in-depth analysis detailing your home's value as well as a comparison with similar homes in the area
Home Values in the Area
Average Home Value in this Area
Purchase History
| Date | Buyer | Sale Price | Title Company |
|---|---|---|---|
| Armstrong-Beatty Mosiah Vernon | $65,800 | -- | |
| Evanridge Properties Llc | -- | Scott Timothy E | |
| Evanridge Properties Llc | $237,999 | None Available | |
| -- | $92,000 | -- | |
| Denton Bradford H | $34,000 | -- | |
| -- | $23,000 | -- |
Source: Public Records
Mortgage History
| Date | Status | Borrower | Loan Amount |
|---|---|---|---|
| Open | Armstrong-Beatty Mosiah Vernon | $64,608 | |
| Previous Owner | -- | $20,700 |
Source: Public Records
Tax History Compared to Growth
Tax History
| Year | Tax Paid | Tax Assessment Tax Assessment Total Assessment is a certain percentage of the fair market value that is determined by local assessors to be the total taxable value of land and additions on the property. | Land | Improvement |
|---|---|---|---|---|
| 2024 | -- | $16,475 | $3,025 | $13,450 |
| 2023 | $725 | $16,475 | $3,025 | $13,450 |
| 2022 | $725 | $16,475 | $3,025 | $13,450 |
| 2021 | $706 | $16,475 | $3,025 | $13,450 |
| 2020 | $408 | $16,475 | $3,025 | $13,450 |
| 2019 | $736 | $15,875 | $3,025 | $12,850 |
| 2018 | $719 | $15,875 | $3,025 | $12,850 |
| 2017 | $719 | $15,875 | $3,025 | $12,850 |
| 2016 | $460 | $9,900 | $1,375 | $8,525 |
| 2014 | $434 | $9,912 | $0 | $0 |
Source: Public Records
Map
Nearby Homes
- 1706 Highland St
- 1725 Highland St
- 2492 Bridgeforth Crossing
- 1817 Avalon St
- 1648 E St
- 1585 Fort Henry Dr Unit P-D
- 1421 Linville St
- 2217 Ashwood Ave
- 2221 Ashwood Ave
- 1557 Greenfield Ave
- 2133 Stadium Dr
- 1809 Autumn Ln
- 1604 Hermitage Dr
- 1616 Hermitage Dr
- 2177 Steadman St
- 1312 Pineola Ave
- 1321 Pineola Ave
- 1357 Watauga St
- 1528 Carolina Ave
- 1604 Carolina Ave
- 1714 Highland St
- 1702 Highland St
- 1718 Highland St
- 1639 Spruce St
- 1646 Vance St
- 1645 Spruce St
- 1722 Highland St
- 1642 Vance St
- 1640 Highland St Unit 1640
- 1709 Highland St
- 1637 Spruce St
- 1713 Highland St
- 1701 Highland St
- 1717 Highland St
- 1638 Vance St
- 1701 St
- 1641 Vance St
- 1633 Spruce St
- 1730 Highland St
- 1637 Highland St