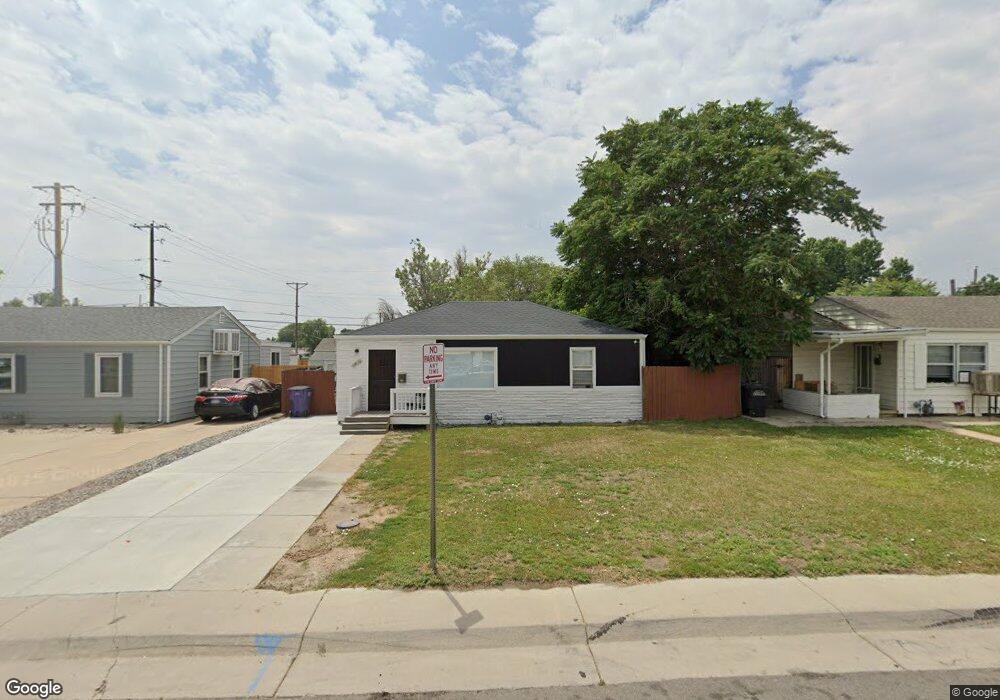
1710 W 52nd Ave Denver, CO 80221
Chaffee Park NeighborhoodEstimated Value: $349,000 - $489,000
2
Beds
1
Bath
770
Sq Ft
$521/Sq Ft
Est. Value
About This Home
This home is located at 1710 W 52nd Ave, Denver, CO 80221 and is currently estimated at $401,024, approximately $520 per square foot. 1710 W 52nd Ave is a home located in Denver County with nearby schools including Beach Court Elementary School, Bryant Webster Dual Language School, and Denver Montessori Junior/Senior High School.
Ownership History
Date
Name
Owned For
Owner Type
Purchase Details
Closed on
Dec 26, 2018
Sold by
Pecos Place Builders Llc
Bought by
Yan Rachel
Current Estimated Value
Home Financials for this Owner
Home Financials are based on the most recent Mortgage that was taken out on this home.
Original Mortgage
$312,773
Outstanding Balance
$275,103
Interest Rate
4.62%
Estimated Equity
$125,921
Purchase Details
Closed on
May 8, 2012
Sold by
Feldman Raisa
Bought by
Ezbyshka Llc
Purchase Details
Closed on
Dec 30, 2009
Sold by
Secretary Of Housing & Urban Development
Bought by
Feldman Raisa
Purchase Details
Closed on
Aug 25, 2009
Sold by
Riedel Edie Mae
Bought by
Secretary Of Housing & Urban Development
Purchase Details
Closed on
Aug 4, 2004
Sold by
Tubbesing Richard F and Holligan Francis J
Bought by
Riedel Edie Mae
Home Financials for this Owner
Home Financials are based on the most recent Mortgage that was taken out on this home.
Original Mortgage
$127,991
Interest Rate
6.02%
Mortgage Type
FHA
Create a Home Valuation Report for This Property
The Home Valuation Report is an in-depth analysis detailing your home's value as well as a comparison with similar homes in the area
Home Values in the Area
Average Home Value in this Area
Purchase History
| Date | Buyer | Sale Price | Title Company |
|---|---|---|---|
| Yan Rachel | $399,773 | -- | |
| Ezbyshka Llc | -- | None Available | |
| Feldman Raisa | $61,000 | Wtg | |
| Secretary Of Housing & Urban Development | -- | None Available | |
| Riedel Edie Mae | $130,000 | Title America |
Source: Public Records
Mortgage History
| Date | Status | Borrower | Loan Amount |
|---|---|---|---|
| Open | Yan Rachel | $312,773 | |
| Closed | Yan Rachel | -- | |
| Previous Owner | Riedel Edie Mae | $127,991 |
Source: Public Records
Tax History Compared to Growth
Tax History
| Year | Tax Paid | Tax Assessment Tax Assessment Total Assessment is a certain percentage of the fair market value that is determined by local assessors to be the total taxable value of land and additions on the property. | Land | Improvement |
|---|---|---|---|---|
| 2024 | $1,892 | $23,890 | $11,020 | $12,870 |
| 2023 | $1,851 | $23,890 | $11,020 | $12,870 |
| 2022 | $1,634 | $20,550 | $11,440 | $9,110 |
| 2021 | $1,577 | $21,140 | $11,770 | $9,370 |
| 2020 | $1,449 | $19,530 | $11,770 | $7,760 |
| 2019 | $1,408 | $19,530 | $11,770 | $7,760 |
| 2018 | $1,158 | $14,970 | $5,930 | $9,040 |
| 2017 | $1,155 | $14,970 | $5,930 | $9,040 |
| 2016 | $1,059 | $12,990 | $2,619 | $10,371 |
| 2015 | $1,015 | $12,990 | $2,619 | $10,371 |
| 2014 | $733 | $8,820 | $2,675 | $6,145 |
Source: Public Records
Map
Nearby Homes
- 1540 W 52nd Ave
- 1870 W 51st Ave
- 1700 W Stoll Place
- 5401 Raritan Way
- 1850 W 50th Ave
- 5413 Shoshone St
- 5480 Raritan Way
- 4956 Umatilla St
- 5445 Vallejo St
- 1741 W 55th Place
- 4856 Umatilla St
- 5540 Vallejo St
- 2541 W 52nd Ave
- 1801 W 47th Ave
- 2543 W 54th Ave
- 5515 Zuni St
- 1901 W 47th Ave
- 5115 Clay St
- 4901 Bryant St
- 1828 W 46th Ave
- 1720 W 52nd Ave
- 1700 W 52nd Ave
- 1730 W 52nd Ave
- 1651 W 52nd Ave
- 5201 Pecos St
- 1705 W Berkeley Place
- 1701 W Berkeley Place
- 1715 W Berkeley Place
- 1740 W 52nd Ave
- 5205 Pecos St
- 1550 W 52nd Ave
- 1725 W Berkeley Place
- 1707 W 52nd Ave
- 1750 W 52nd Ave
- 1735 W Berkeley Place
- 1599 W Berkeley Place
- 1745 W Berkeley Place
- 1760 W 52nd Ave
- 1720 W Berkeley Place
- 1581 W Berkeley Place