Estimated Value: $1,043,000 - $1,199,000
3
Beds
3
Baths
2,006
Sq Ft
$554/Sq Ft
Est. Value
About This Home
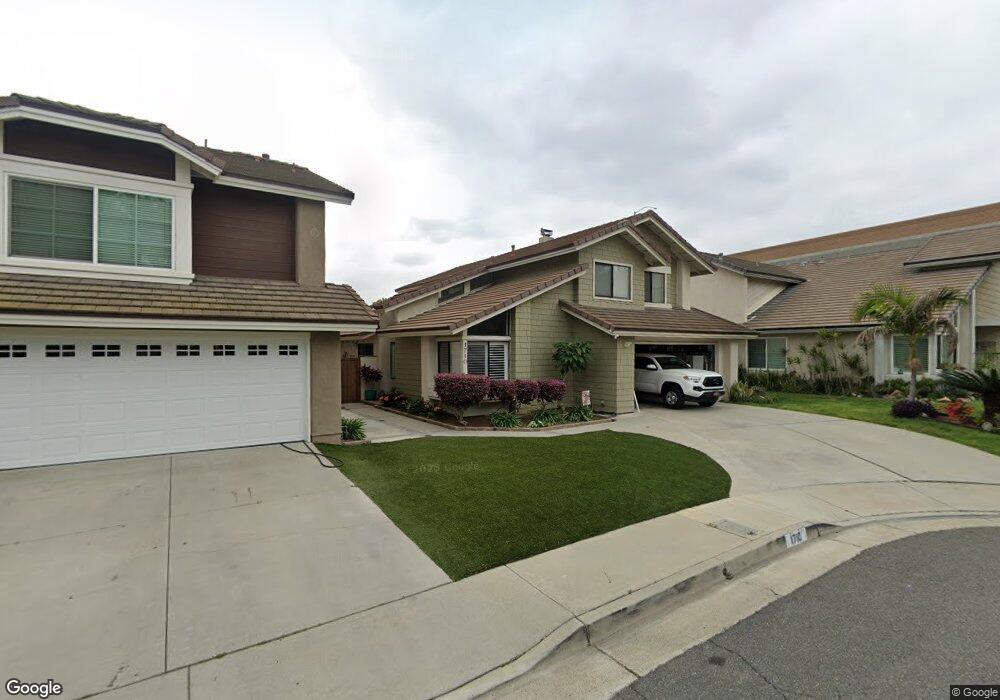
This home is located at 1710 Wisteria Dr, Brea, CA 92821 and is currently estimated at $1,111,977, approximately $554 per square foot. 1710 Wisteria Dr is a home located in Orange County with nearby schools including Brea Country Hills Elementary School, Brea Junior High School, and Brea-Olinda High School.
Ownership History
Date
Name
Owned For
Owner Type
Purchase Details
Closed on
May 9, 2019
Sold by
Robertson Rick L and Robertson Marcie E
Bought by
Robertson Rick L and Robertson Marcie E
Current Estimated Value
Purchase Details
Closed on
Sep 15, 1997
Sold by
Bauer Linda M
Bought by
Robertson Rick and Robertson Marcie
Home Financials for this Owner
Home Financials are based on the most recent Mortgage that was taken out on this home.
Original Mortgage
$172,500
Outstanding Balance
$26,780
Interest Rate
7.49%
Estimated Equity
$1,085,197
Purchase Details
Closed on
Mar 28, 1997
Sold by
Pickles Jerry D
Bought by
Bauer Linda M
Purchase Details
Closed on
Jul 12, 1993
Sold by
Dobeck Michael P and Dobeck Lori D
Bought by
Pickles Jerry D and Pickles Linda B
Home Financials for this Owner
Home Financials are based on the most recent Mortgage that was taken out on this home.
Original Mortgage
$185,600
Interest Rate
6.88%
Create a Home Valuation Report for This Property
The Home Valuation Report is an in-depth analysis detailing your home's value as well as a comparison with similar homes in the area
Home Values in the Area
Average Home Value in this Area
Purchase History
| Date | Buyer | Sale Price | Title Company |
|---|---|---|---|
| Robertson Rick L | -- | None Available | |
| Robertson Rick | $230,000 | Southland Title | |
| Bauer Linda M | -- | -- | |
| Pickles Jerry D | $232,000 | Commonwealth Land Title |
Source: Public Records
Mortgage History
| Date | Status | Borrower | Loan Amount |
|---|---|---|---|
| Open | Robertson Rick | $172,500 | |
| Previous Owner | Pickles Jerry D | $185,600 | |
| Closed | Robertson Rick | $34,500 |
Source: Public Records
Tax History Compared to Growth
Tax History
| Year | Tax Paid | Tax Assessment Tax Assessment Total Assessment is a certain percentage of the fair market value that is determined by local assessors to be the total taxable value of land and additions on the property. | Land | Improvement |
|---|---|---|---|---|
| 2025 | $4,273 | $367,241 | $147,383 | $219,858 |
| 2024 | $4,273 | $360,041 | $144,493 | $215,548 |
| 2023 | $4,154 | $352,982 | $141,660 | $211,322 |
| 2022 | $4,110 | $346,061 | $138,882 | $207,179 |
| 2021 | $4,033 | $339,276 | $136,159 | $203,117 |
| 2020 | $4,005 | $335,798 | $134,763 | $201,035 |
| 2019 | $3,901 | $329,214 | $132,120 | $197,094 |
| 2018 | $3,841 | $322,759 | $129,529 | $193,230 |
| 2017 | $3,769 | $316,431 | $126,989 | $189,442 |
| 2016 | $3,694 | $310,227 | $124,499 | $185,728 |
| 2015 | $3,642 | $305,568 | $122,629 | $182,939 |
| 2014 | $3,537 | $299,583 | $120,227 | $179,356 |
Source: Public Records
Map
Nearby Homes
- 2034 Chevy Chase Dr
- 2328 Carrotwood Dr
- 699 Balsa Ave
- 329 Surry Ct
- 2523 Rimcrest Rd
- 2583 Sandpebble Ln
- 604 E Ash St
- 2488 E Kern River Ln
- 3215 Stonewood Ct
- 335 Buttonwood Dr
- 2902 Parkwood Ct
- 273 Mountain Ct
- 931 Kings Canyon Rd
- 915 Kings Canyon Rd
- 242 Mountain Ct
- 2938 Arboridge Ct
- 2991 Gingerwood Cir
- 2851 Rolling Hills Dr Unit 257
- 2851 Rolling Hills Dr Unit 248
- 225 S Redwood Ave Unit 19
- 1718 Wisteria Dr
- 1702 Wisteria Dr
- 1726 Wisteria Dr
- 1713 Harvest Ln
- 1721 Harvest Ln
- 1705 Harvest Ln
- 1729 Harvest Ln
- 1703 Wisteria Dr
- 1711 Wisteria Dr
- 1719 Wisteria Dr
- 1737 Harvest Ln
- 1727 Wisteria Dr
- 1704 Harvest Ln
- 1712 Harvest Ln
- 1716 Summerfield Cir
- 1708 Summerfield Cir
- 1724 Summerfield Cir
- 1720 Harvest Ln
- 1700 Summerfield Cir
- 1732 Summerfield Cir